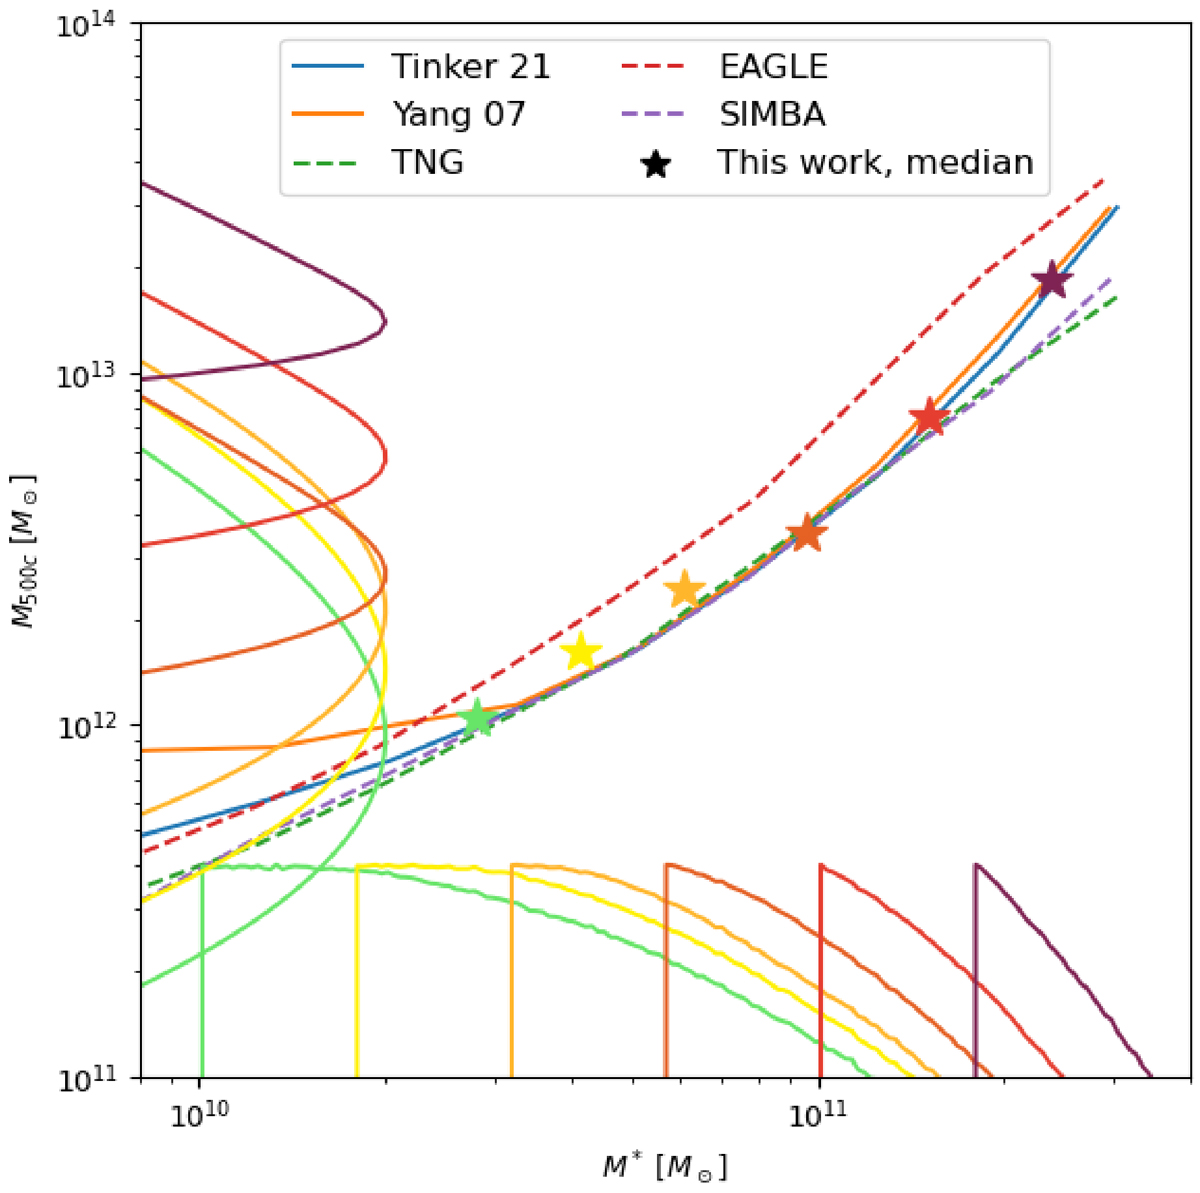
Fig. 7.
Download original image
Inferred stellar-to-halo-mass relation for each sample observed. The stars are located at the median values. The distributions of the halo and stellar masses of the sample studied are shown with colored solid lines. There is a fair agreement with previous models Yang et al. (2005), Tinker (2021) and with the prediction from the TNG and SIMBA hydrodynamical simulations (Pillepich et al. 2018; Davé et al. 2019; Schaye et al. 2015).
Current usage metrics show cumulative count of Article Views (full-text article views including HTML views, PDF and ePub downloads, according to the available data) and Abstracts Views on Vision4Press platform.
Data correspond to usage on the plateform after 2015. The current usage metrics is available 48-96 hours after online publication and is updated daily on week days.
Initial download of the metrics may take a while.