Fig. 6.
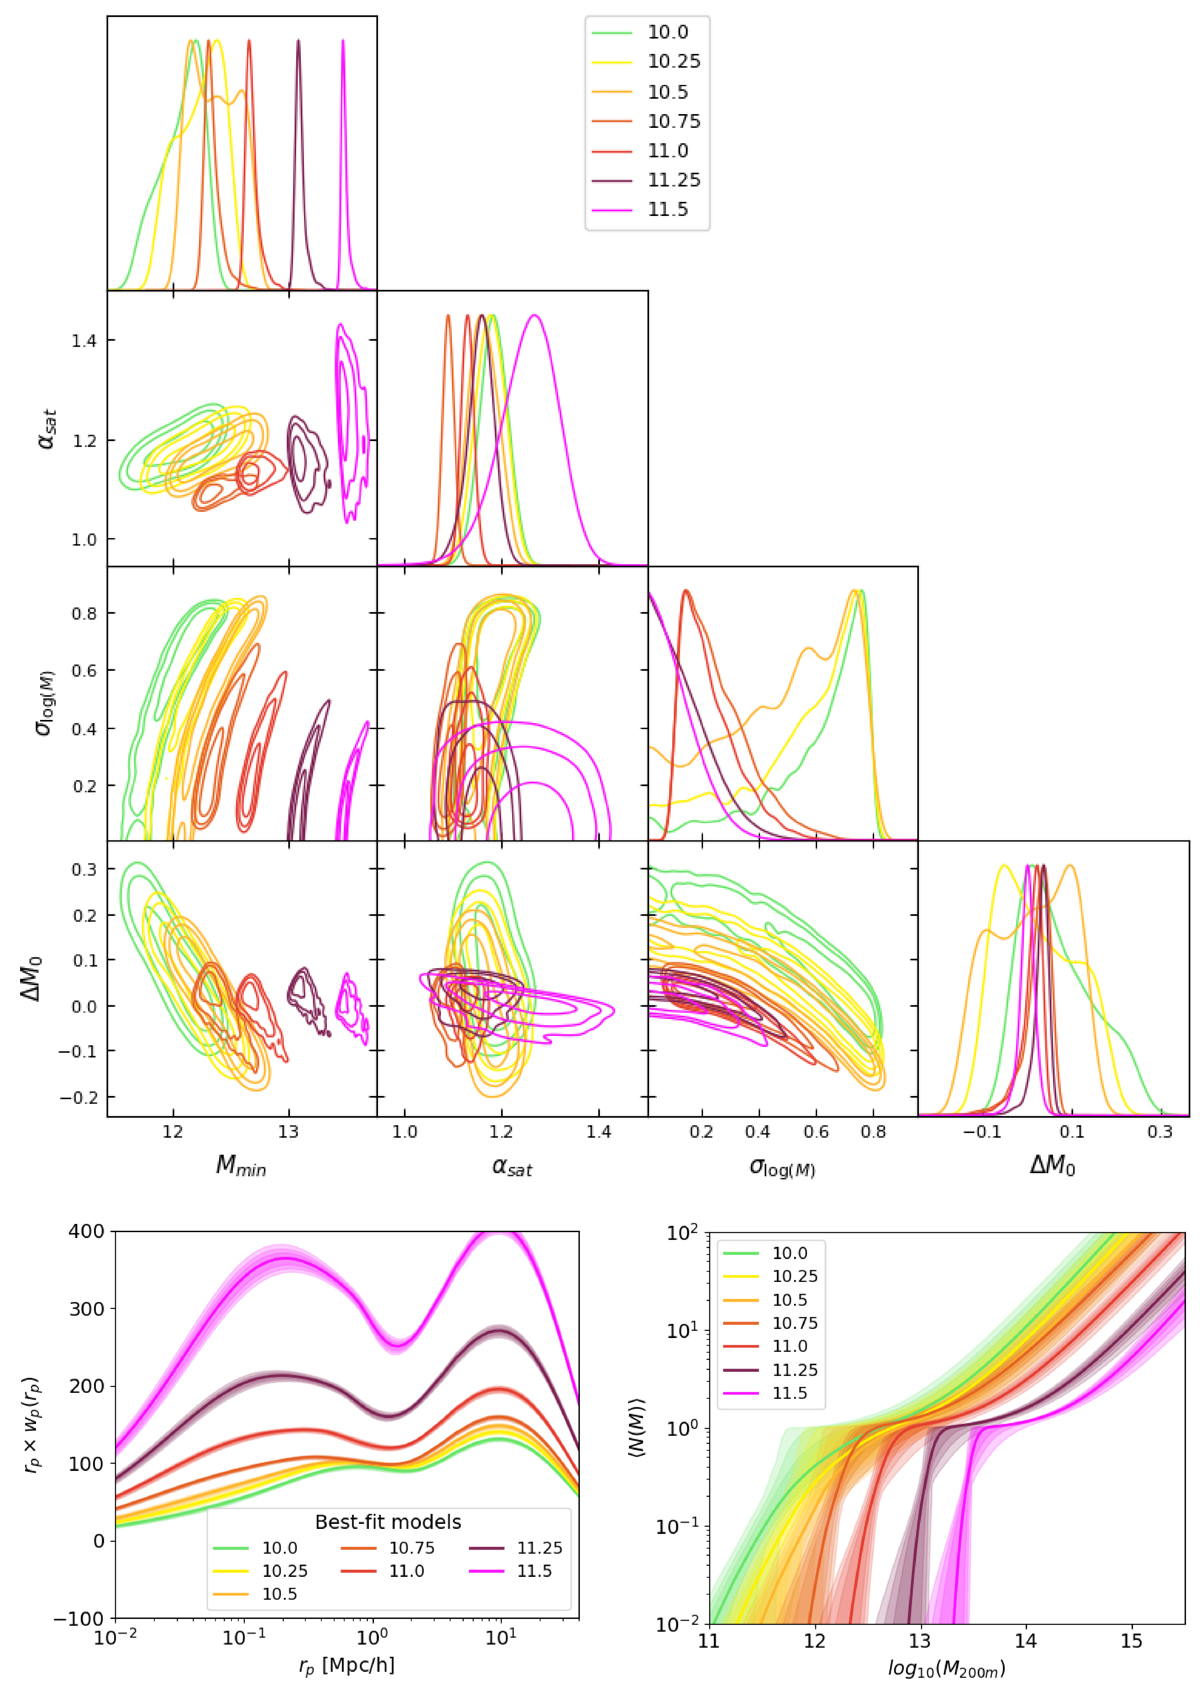
Download original image
HOD best-fit model parameters obtained by adjusting the model from Sect. 4 on the wp(rp) measurements obtained in Sect. 3 and shown in Fig. 2. Differently colored lines represent different samples, identified here by the logarithm of their minimum stellar mass, in solar masses. The color scheme follows that of Fig. 1. We show the corner plot of the parameters and their 1,2,3σ contours in the top panel. The trends of the parameters obtained and their correlation with the stellar mass threshold of the different galaxy samples is sensible: Mmin is correlated with the minimum stellar mass, while σlog(M) is anti-correlated. Model wp(rp) obtained and their 1,2,3σ contours (bottom left). Posterior HOD with 1,2,3 σ contours (bottom right). The ordering of the HOD curves follows the stellar mass selection and follows expectations. An individual comparison of the models and the measurements are shown in Fig. C.5.
Current usage metrics show cumulative count of Article Views (full-text article views including HTML views, PDF and ePub downloads, according to the available data) and Abstracts Views on Vision4Press platform.
Data correspond to usage on the plateform after 2015. The current usage metrics is available 48-96 hours after online publication and is updated daily on week days.
Initial download of the metrics may take a while.