Fig. 5.
Download original image
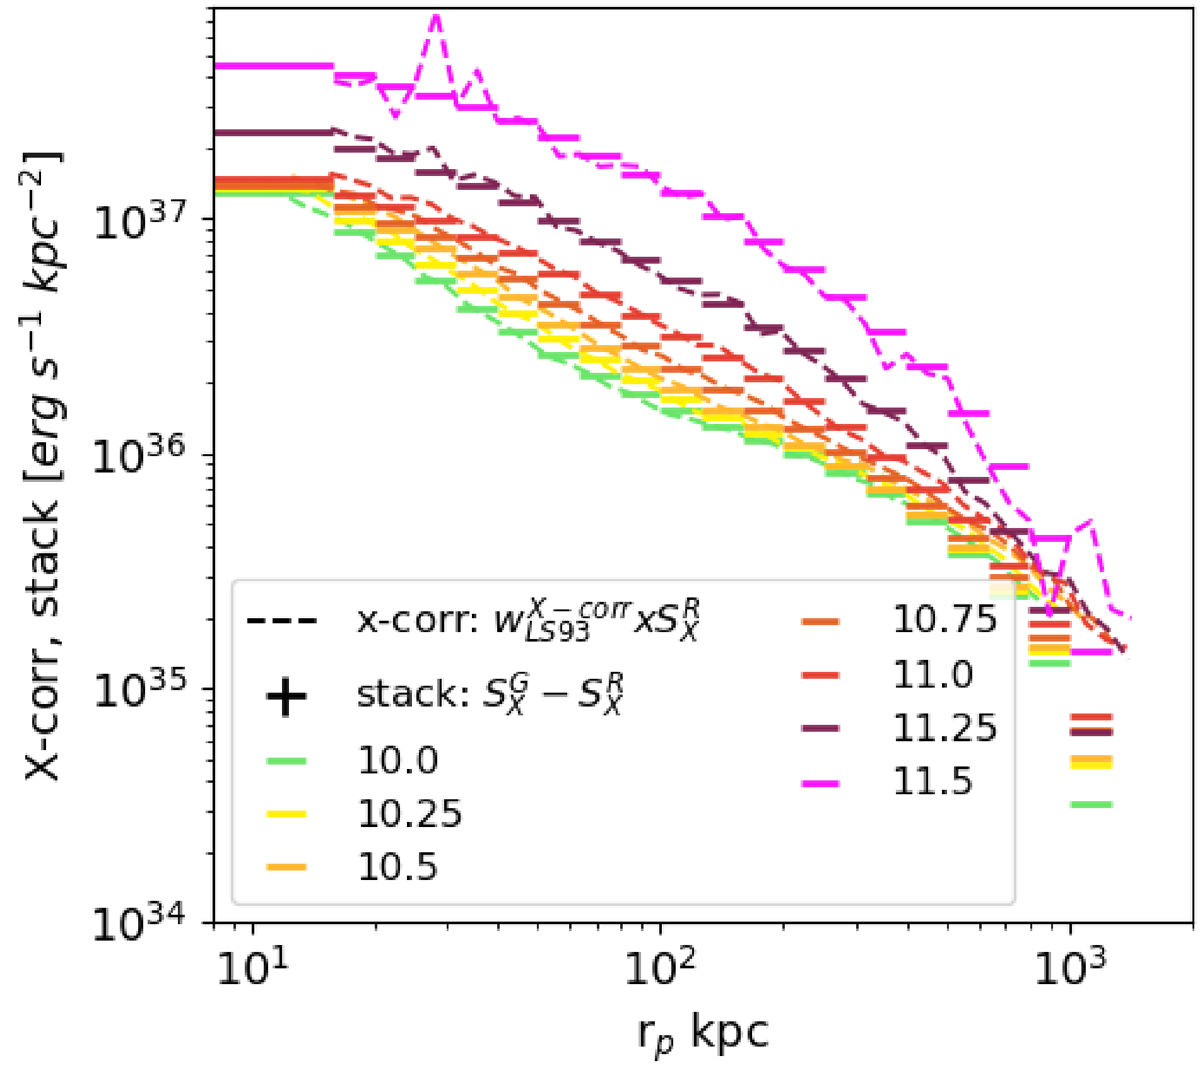
Comparison of the two cross-correlation estimators in physical units for the stellar mass selected galaxy samples. Differently colored lines represent different samples, identified here by the logarithm of their minimum stellar mass, in solar masses. The color scheme follows that of Fig. 1. The background subtracted surface brightness profiles in the 0.5–2 keV soft band as a function of proper separation (rp, kpc) is shown in steps (![]() , Eq. (3)). The cross-correlation between galaxies and X-ray events is shown with dashed lines (
, Eq. (3)). The cross-correlation between galaxies and X-ray events is shown with dashed lines (![]() , Eq. (2)). The brightness of the emission is correlated with the stellar mass threshold. The shape of the profiles changes with the stellar mass threshold. The individual best-fit models for these surface brightness profile are presented in Figs. 8, 9, and 10.
, Eq. (2)). The brightness of the emission is correlated with the stellar mass threshold. The shape of the profiles changes with the stellar mass threshold. The individual best-fit models for these surface brightness profile are presented in Figs. 8, 9, and 10.
Current usage metrics show cumulative count of Article Views (full-text article views including HTML views, PDF and ePub downloads, according to the available data) and Abstracts Views on Vision4Press platform.
Data correspond to usage on the plateform after 2015. The current usage metrics is available 48-96 hours after online publication and is updated daily on week days.
Initial download of the metrics may take a while.