Open Access
Fig. 2.
Download original image
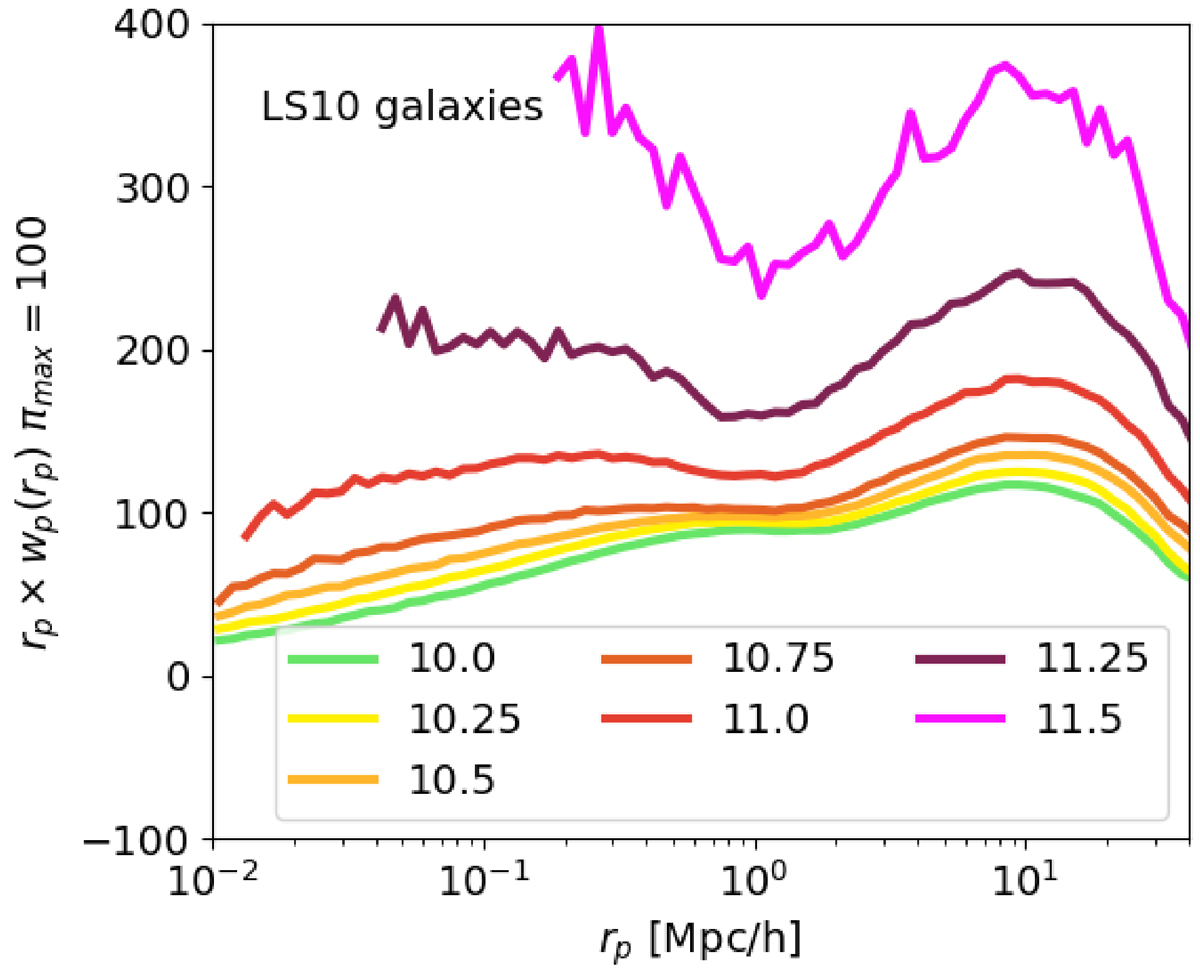
Projected galaxy auto-correlation function (wp(rp)) obtained with the LS10 galaxy samples on ∼16 000 deg2. We fit HOD models on these measurements. Differently colored lines represent different samples, identified here by the logarithm of their minimum stellar mass, in solar masses. The color scheme follows that of Fig. 1.
Current usage metrics show cumulative count of Article Views (full-text article views including HTML views, PDF and ePub downloads, according to the available data) and Abstracts Views on Vision4Press platform.
Data correspond to usage on the plateform after 2015. The current usage metrics is available 48-96 hours after online publication and is updated daily on week days.
Initial download of the metrics may take a while.