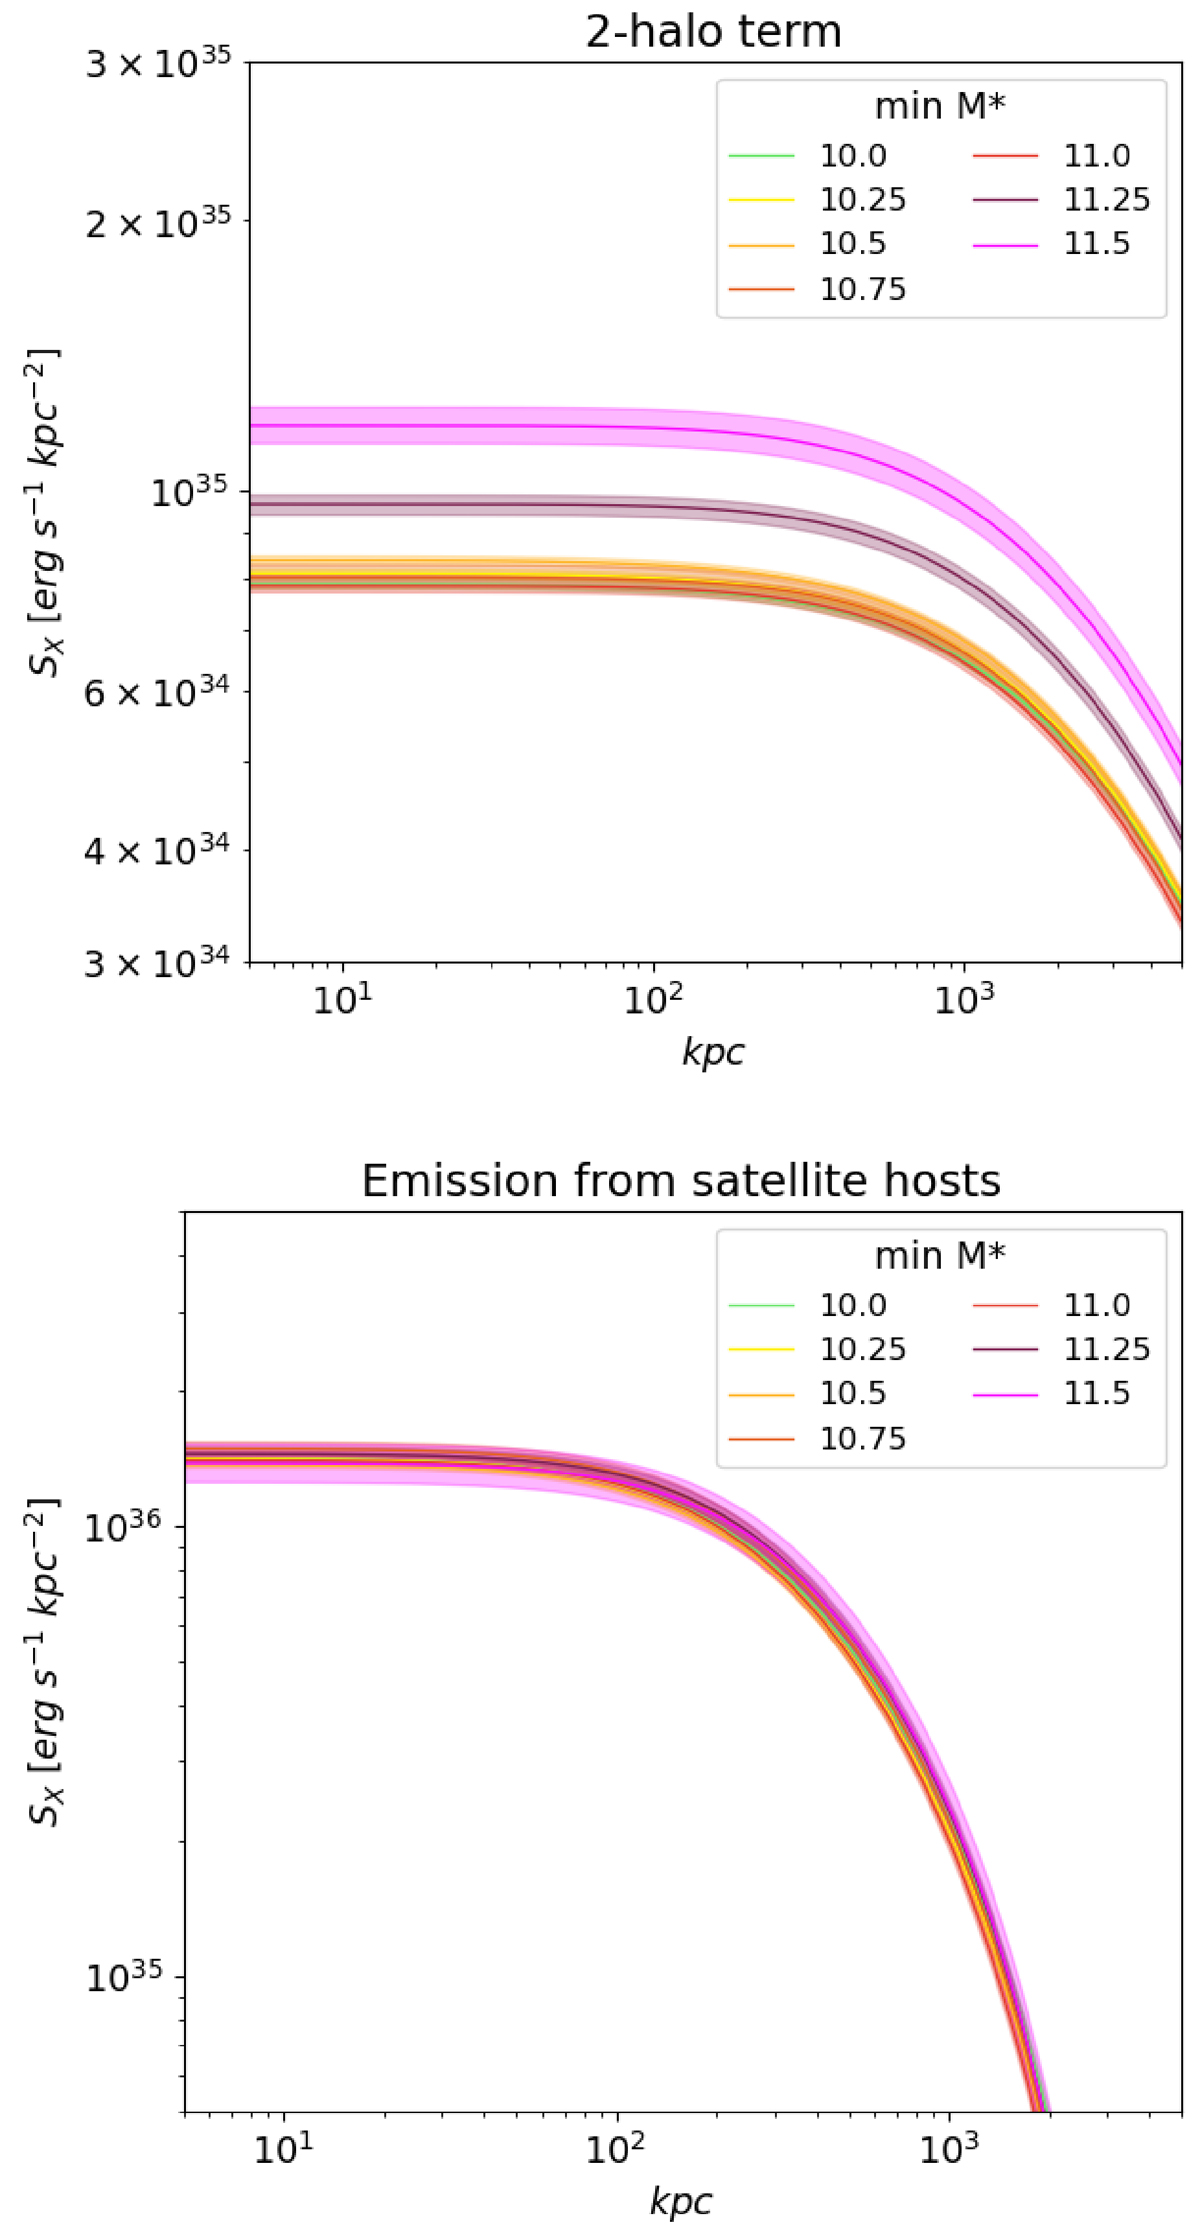
Fig. 14.
Download original image
Comparison of components obtained for each sample: the two-halo term (top) and satellite hosts (bottom). Differently colored shaded areas represent different samples, identified here by the logarithm of their minimum stellar mass, in solar masses following the color scheme of Fig. 1. The evolution of the two-halo term (satellite) is linked to the evolution of the large-scale halo bias (mean halo mass hosting satellite galaxies), as shown in Table 3, column “b” (![]() ).
).
Current usage metrics show cumulative count of Article Views (full-text article views including HTML views, PDF and ePub downloads, according to the available data) and Abstracts Views on Vision4Press platform.
Data correspond to usage on the plateform after 2015. The current usage metrics is available 48-96 hours after online publication and is updated daily on week days.
Initial download of the metrics may take a while.