Fig. 2.
Download original image
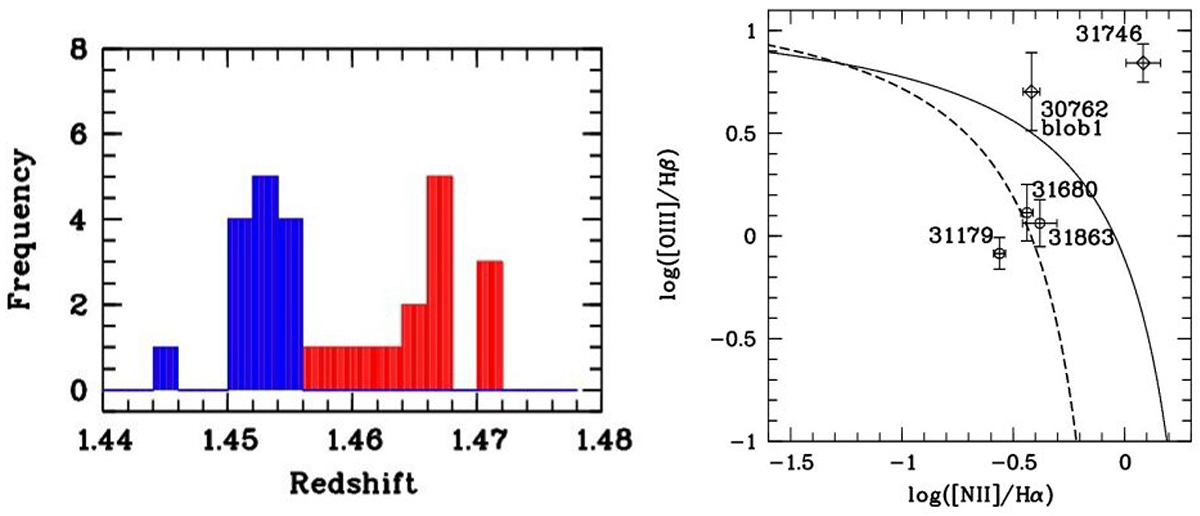
Left panel: Bimodal distribution for the redshifts of 28 cluster galaxies inside a circular area, shown by the large black circle in Fig. 1, with a radius of 250 kpc around the cluster X-ray center. Right panel: Diagnostic diagram BPT (Baldwin et al. 1981) to distinguish star formation dominated galaxies from AGN for objects with all four observed ELs. The SF region of the BPT diagram lies below and to the left of the empirical (dashed) curve of Kauffmann et al. (2003), while the composite region lies between the theoretical (solid) curve of Kewley (2001) and the curve of Kauffmann et al. (2003). Two XMM2215 cluster galaxies are classified as type 2 AGN according to this diagram. Two galaxies lie in the composite region, and one galaxy lies in the region dominated by star formation. Because KMOS IFUs were only placed on galaxies with stellar counterparts detected on images, which was not the case for blob 2 and blob 3, only blob 1 (object 30762) is depicted in the BPT diagram. Additionally, as further discussed in Sect. 4.5, during the VLT-KMOS observations the night skylines would have affected some of the ELs needed for the BPT diagram for blob 2 and blob 3 strongly, given their redshifts.
Current usage metrics show cumulative count of Article Views (full-text article views including HTML views, PDF and ePub downloads, according to the available data) and Abstracts Views on Vision4Press platform.
Data correspond to usage on the plateform after 2015. The current usage metrics is available 48-96 hours after online publication and is updated daily on week days.
Initial download of the metrics may take a while.