Fig. 2
Download original image
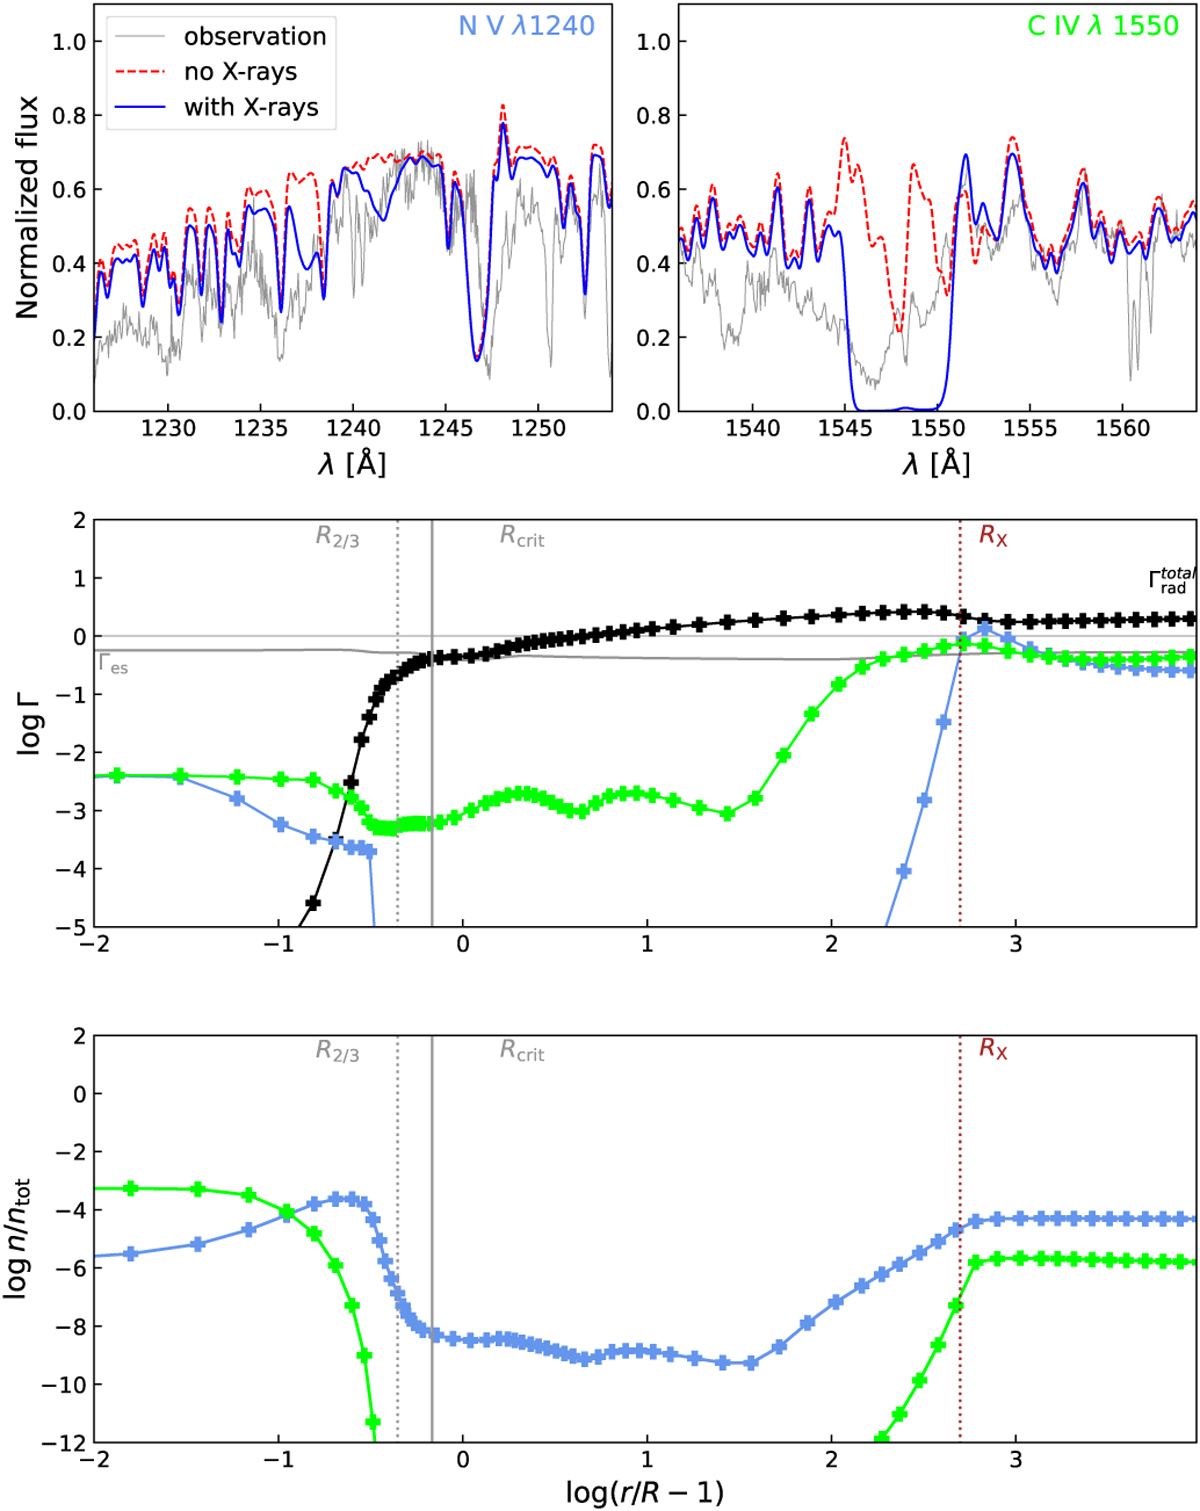
Upper panels: comparison of models’ spectra with and without X-rays (dashed red and solid blue curves, respectively). Middle panel: contribution of Fe III, C IV, and N V for the wind acceleration (black, green, and blue lines, respectively). The lines with thick (thin) crosses indicate the model with (without) X-rays. Lower panel: population number of N V and CIV following the same color and symbol code as the middle panel. in the middle and lower panels, the dashed blue line indicates the photosphere (R2/3) and the solid gray line indicates the critical radius (Rclit). The onset of X-rays (RX) is represented by the dashed brown line.
Current usage metrics show cumulative count of Article Views (full-text article views including HTML views, PDF and ePub downloads, according to the available data) and Abstracts Views on Vision4Press platform.
Data correspond to usage on the plateform after 2015. The current usage metrics is available 48-96 hours after online publication and is updated daily on week days.
Initial download of the metrics may take a while.