Open Access
Fig. D.1
Download original image
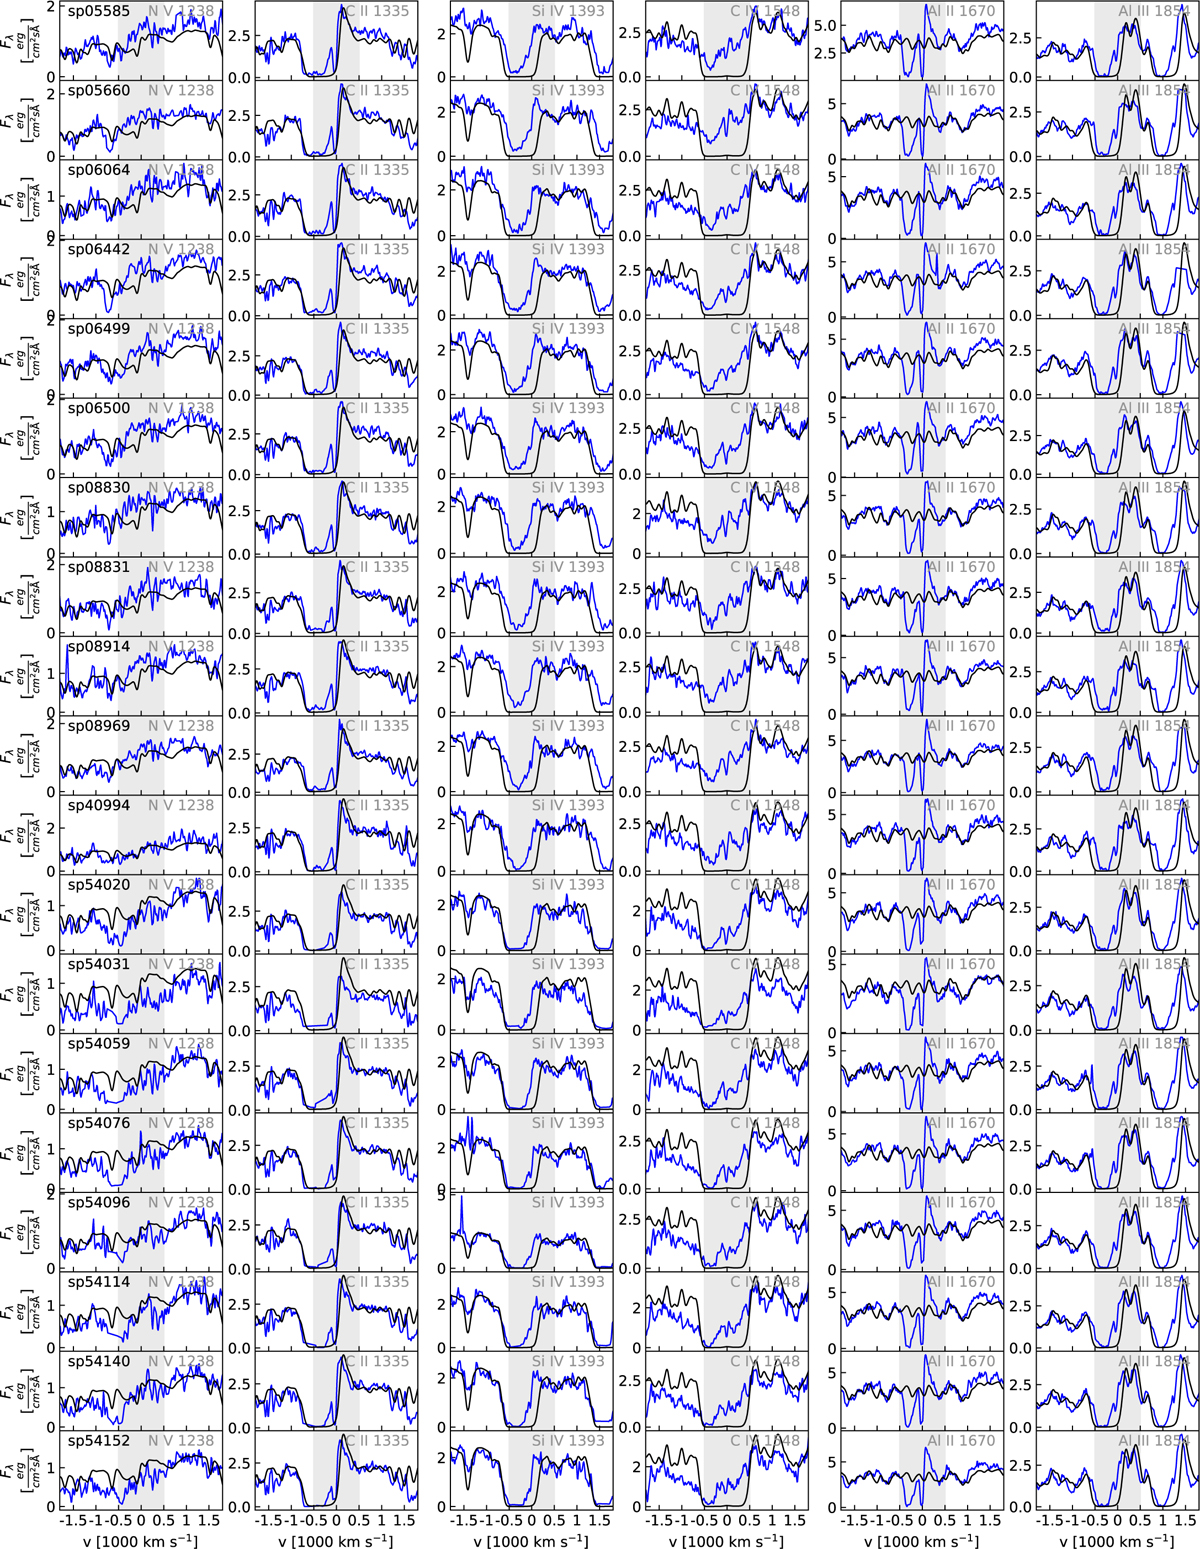
IUE spectra of ζ1 Sco. The blue line is the observation, and the black line is our final PoWRHD model. The shaded area marks the interval of ±500 km s−1 around the reference wavelength.
Current usage metrics show cumulative count of Article Views (full-text article views including HTML views, PDF and ePub downloads, according to the available data) and Abstracts Views on Vision4Press platform.
Data correspond to usage on the plateform after 2015. The current usage metrics is available 48-96 hours after online publication and is updated daily on week days.
Initial download of the metrics may take a while.