Fig. 12
Download original image
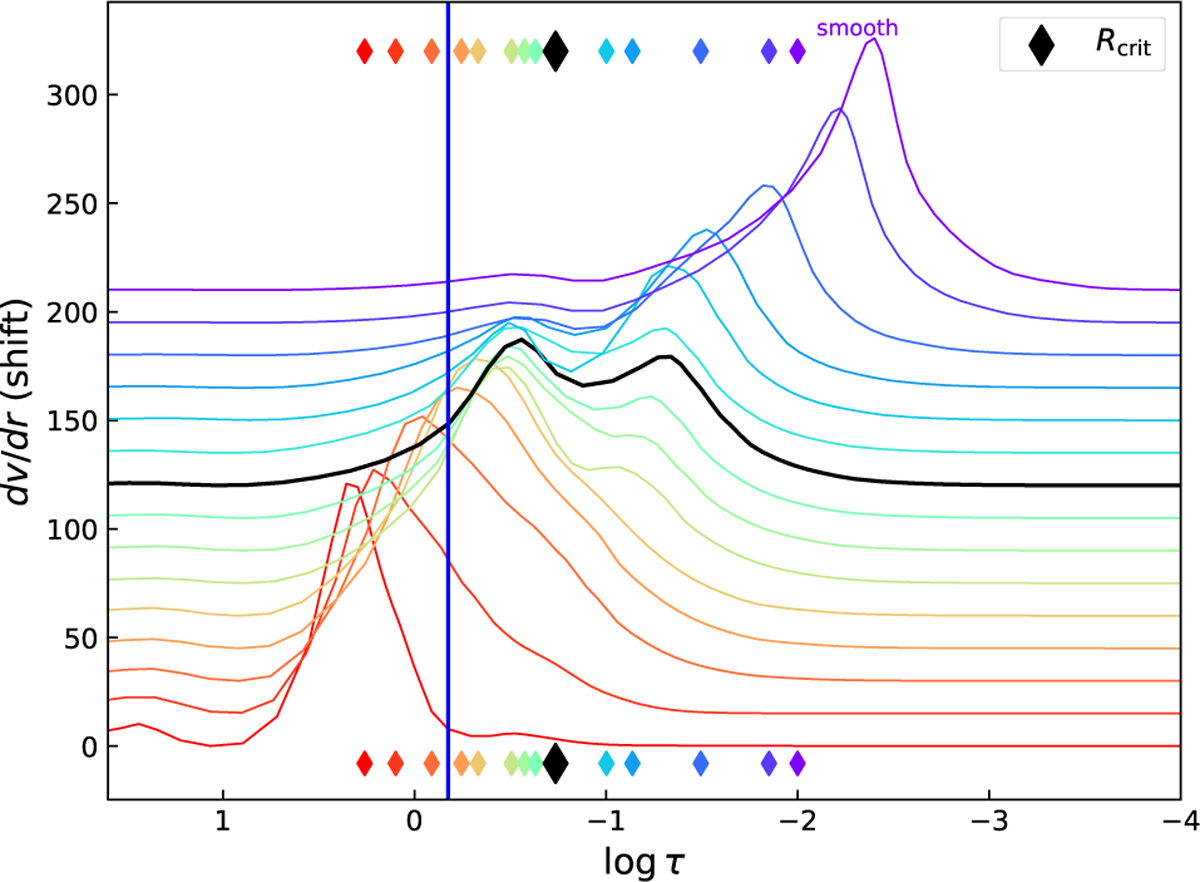
Velocity gradient (dv/dr) vs. Rosseland-mean optical depth (τ). Each model is shifted vertically by an arbitrary amount for visualization purposes. The diamond symbols indicate the critical point, whereas the blue vertical line indicates the photosphere (τ = 2/3). The thick black curve and diamonds refer to the final model (f∞ = 0.66).
Current usage metrics show cumulative count of Article Views (full-text article views including HTML views, PDF and ePub downloads, according to the available data) and Abstracts Views on Vision4Press platform.
Data correspond to usage on the plateform after 2015. The current usage metrics is available 48-96 hours after online publication and is updated daily on week days.
Initial download of the metrics may take a while.