Fig. 10
Download original image
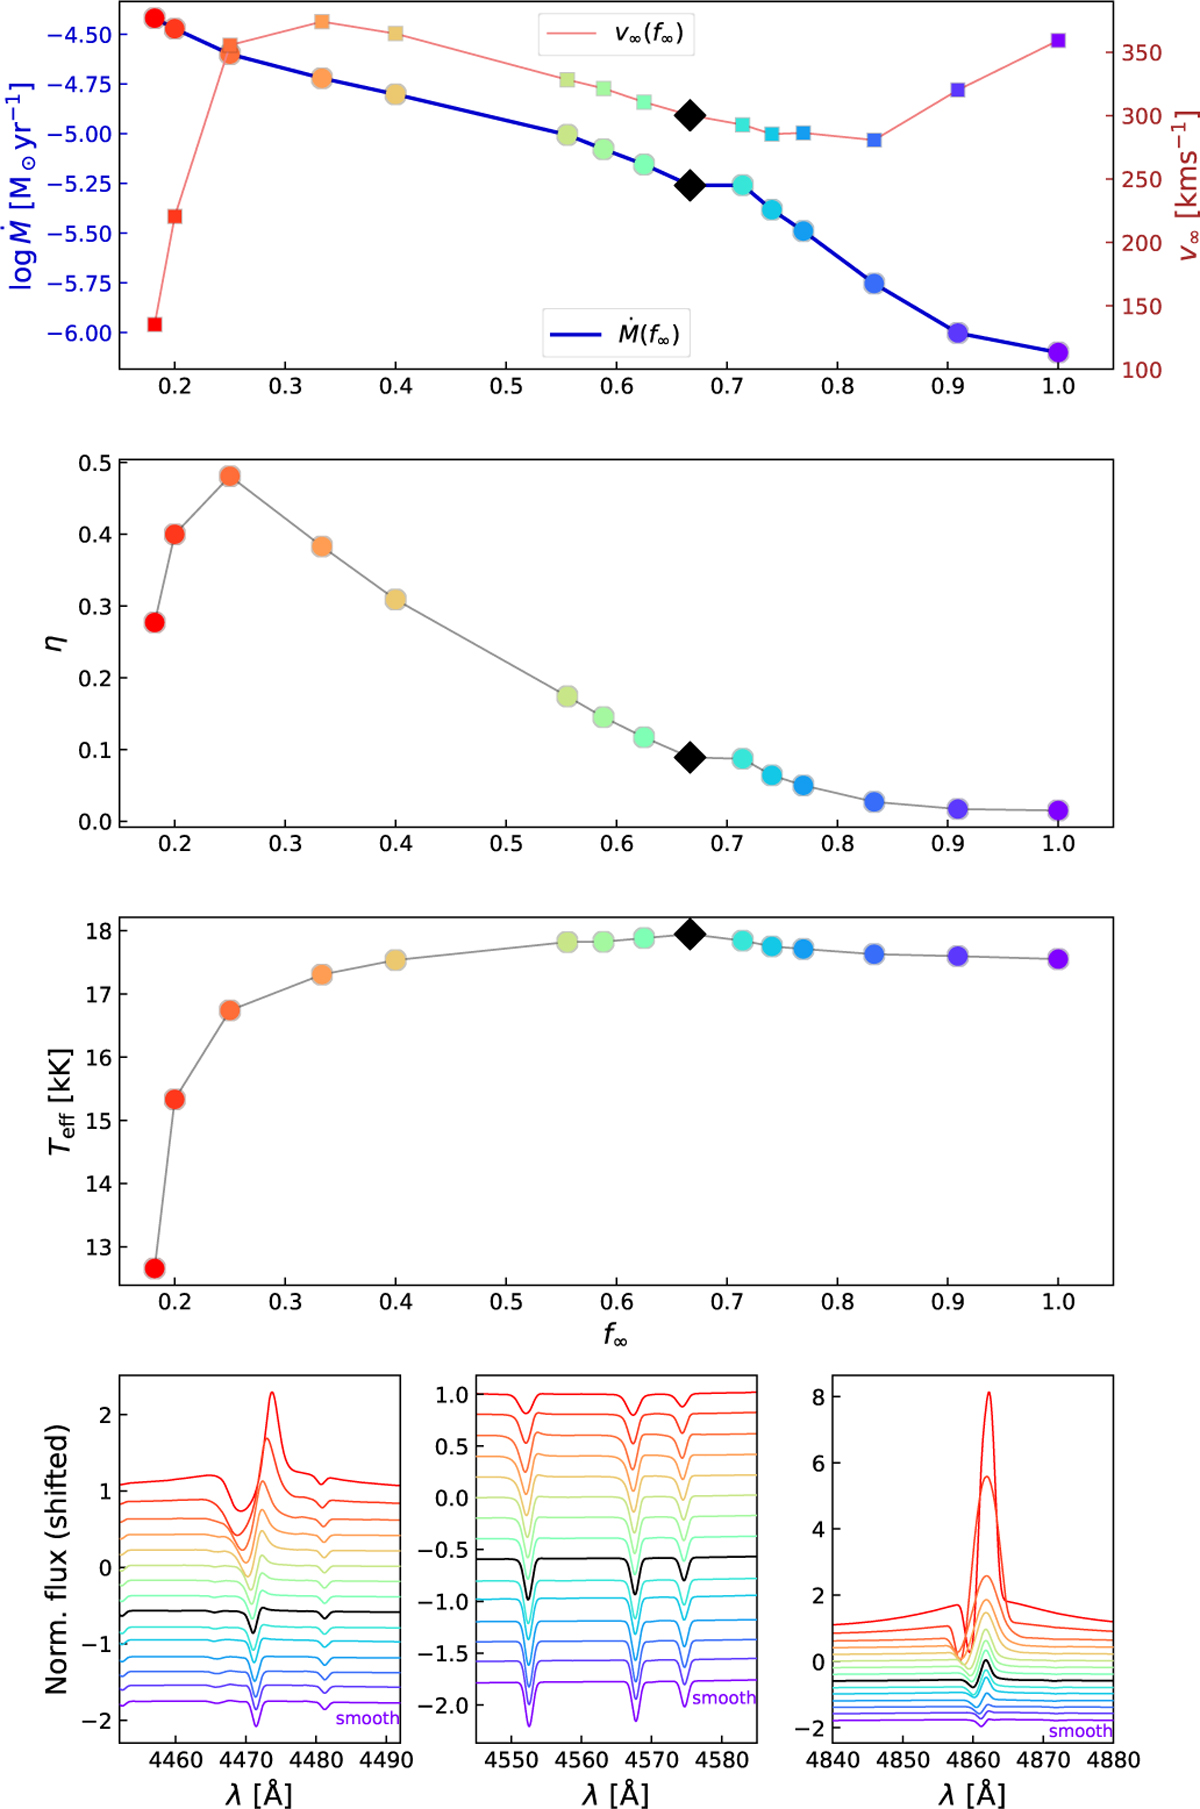
Upper panel: Change in the mass-loss rates, ![]() , and terminal velocities, v∞, as a function of different values of the clumping volume filling factor, f∞. The colors trace f∞ purple indicates the homogeneous-wind model (f∞=1.0) and red is most clumped wind tested (f∞ = 0.2). The final model is represented by the black diamonds. Middle panels: changes in the wind efficiency parameter (η) and Teff as of function of f∞. Lower panels: different lines’ spectral morphology changes as a function of different clumping values. The color scheme is the same as the upper panels, with the thick black line indicating the best-fitting model spectrum.
, and terminal velocities, v∞, as a function of different values of the clumping volume filling factor, f∞. The colors trace f∞ purple indicates the homogeneous-wind model (f∞=1.0) and red is most clumped wind tested (f∞ = 0.2). The final model is represented by the black diamonds. Middle panels: changes in the wind efficiency parameter (η) and Teff as of function of f∞. Lower panels: different lines’ spectral morphology changes as a function of different clumping values. The color scheme is the same as the upper panels, with the thick black line indicating the best-fitting model spectrum.
Current usage metrics show cumulative count of Article Views (full-text article views including HTML views, PDF and ePub downloads, according to the available data) and Abstracts Views on Vision4Press platform.
Data correspond to usage on the plateform after 2015. The current usage metrics is available 48-96 hours after online publication and is updated daily on week days.
Initial download of the metrics may take a while.