Open Access
Fig. A.1.
Download original image
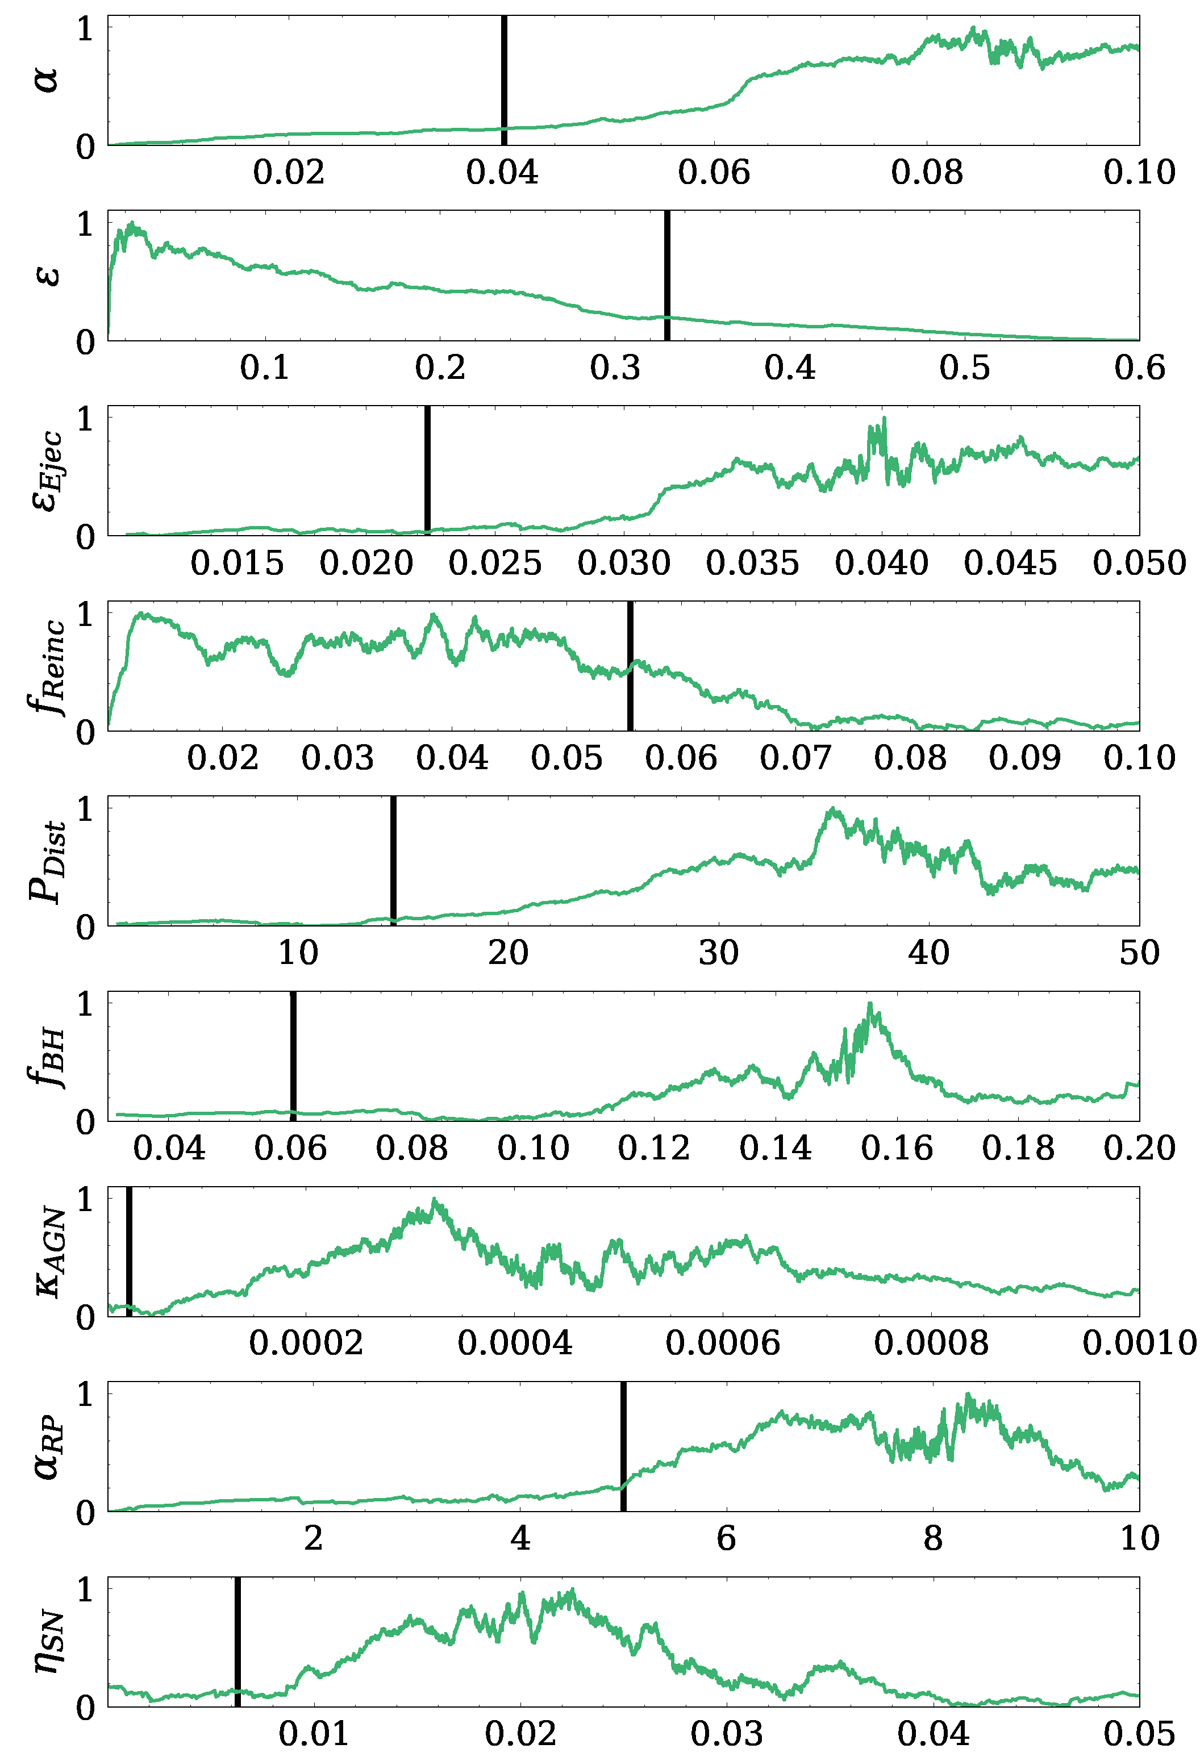
Likelihood for each parameter in the 7K-SAG calibration. The x-axis range shown in each panel corresponds to the range used in the calibration for each parameter. The vertical black line corresponds to the value obtained in the SAG calibration using the subset of DMO MultiDark simulation (Klypin et al. 2016).
Current usage metrics show cumulative count of Article Views (full-text article views including HTML views, PDF and ePub downloads, according to the available data) and Abstracts Views on Vision4Press platform.
Data correspond to usage on the plateform after 2015. The current usage metrics is available 48-96 hours after online publication and is updated daily on week days.
Initial download of the metrics may take a while.