Fig. 12.
Download original image
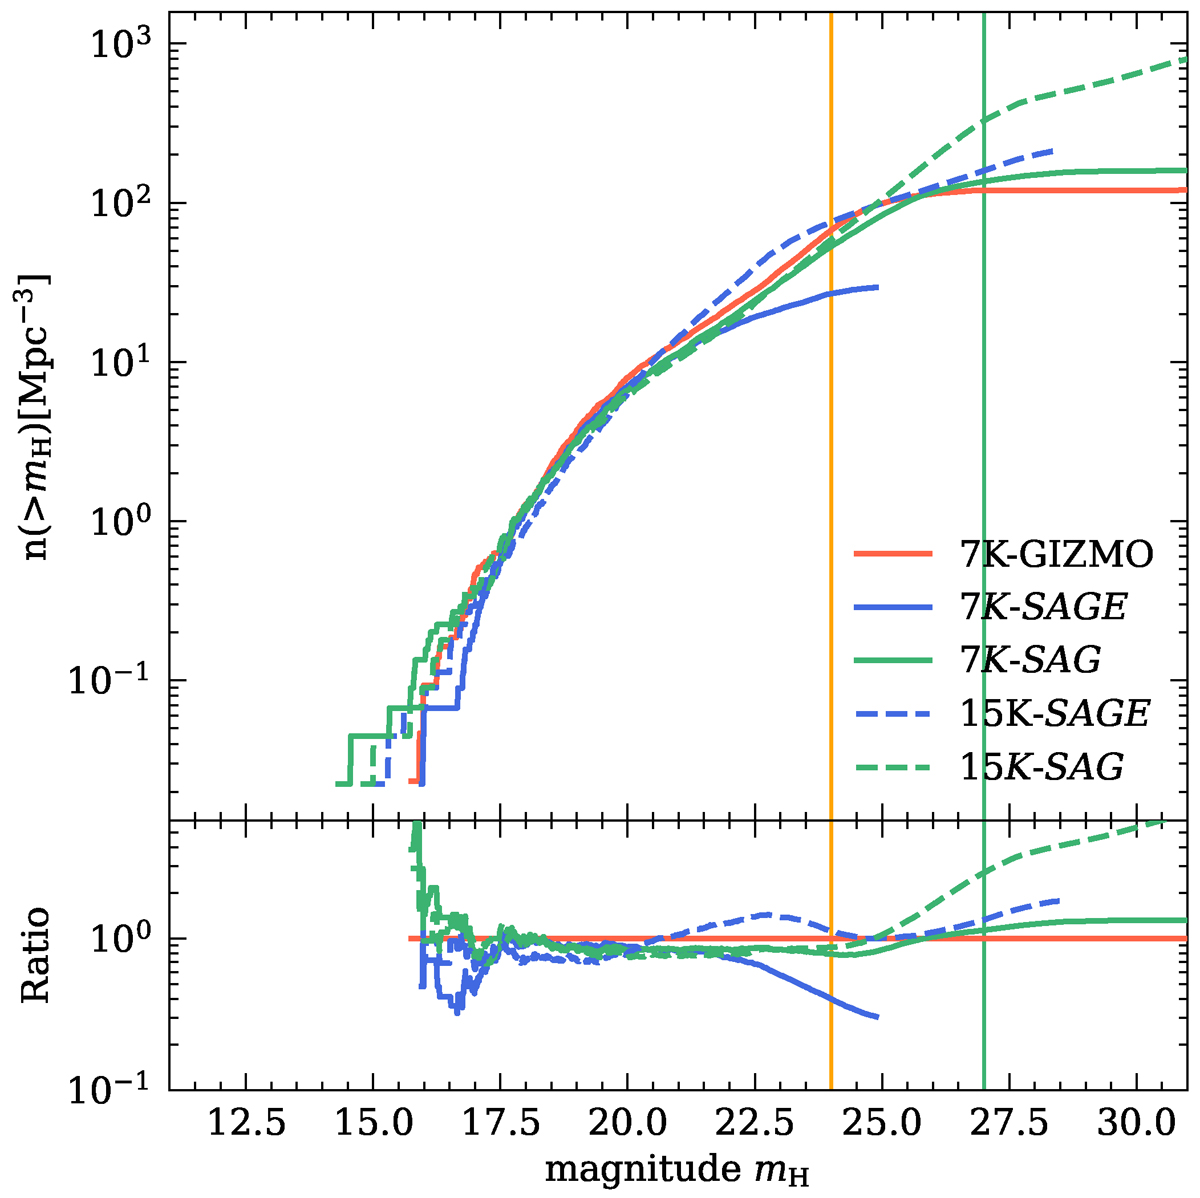
Cumulative luminosity function for apparent magnitude in H-band at z = 1 of the satellite galaxies from all halo clusters with Mhalo > 1014 M⊙ in the coincident regions of all flavours of simulations available in this work. The bottom panel shows the ratio compared to the 7K-GIZMO simulations. The vertical orange line represents the observational limit for EUCLID. The vertical green line represents the beginning of the loss of the power-law slope for 15K-SAG.
Current usage metrics show cumulative count of Article Views (full-text article views including HTML views, PDF and ePub downloads, according to the available data) and Abstracts Views on Vision4Press platform.
Data correspond to usage on the plateform after 2015. The current usage metrics is available 48-96 hours after online publication and is updated daily on week days.
Initial download of the metrics may take a while.