Fig. 11.
Download original image
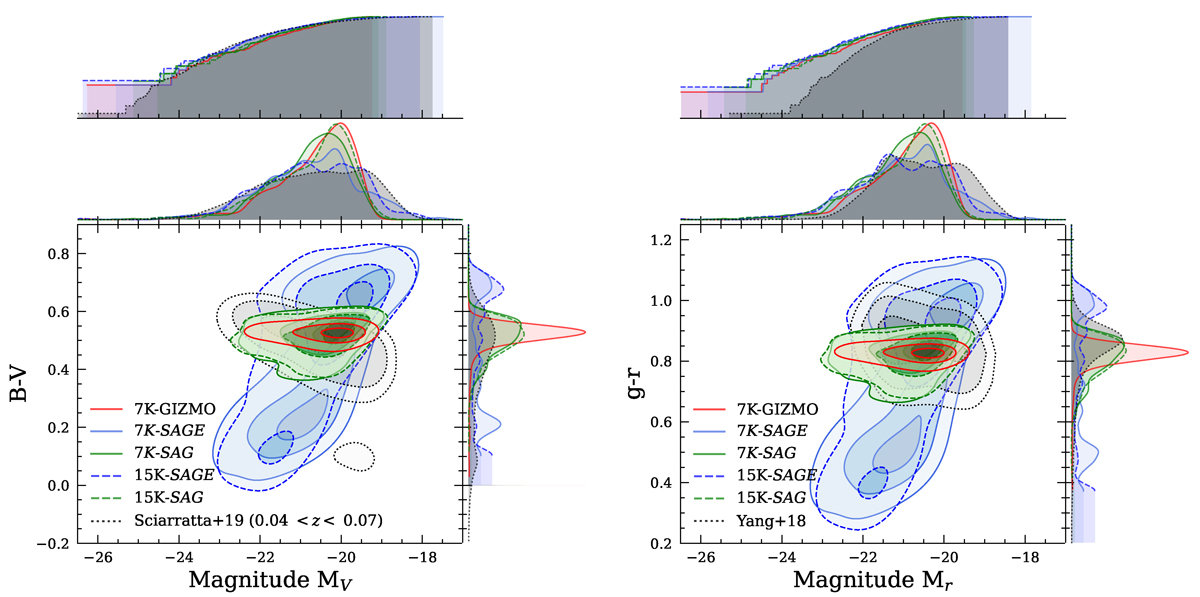
Left panels: the Colour-Magnitude Diagram for B-V bands (biggest panel), normalised cumulative magnitude function (upper panel), density histogram for x-axis and y-axis (second-top and left panel, respectively) for 7K-GIZMO, 7K-SAGE, 7K-SAG, 15K-SAGE and 15K-SAG (see labels for colour and styles). The black dotted contours correspond to observations of nearby galaxy clusters obtained in Sciarratta et al. (2019). Right panels: as left panels but with the bands g-r. In addition, the observations of nearby galaxy clusters obtained in Yang et al. (2018) are shown. The contour levels of each biggest panels correspond to 0.5, 1 and 2 sigma of the data.
Current usage metrics show cumulative count of Article Views (full-text article views including HTML views, PDF and ePub downloads, according to the available data) and Abstracts Views on Vision4Press platform.
Data correspond to usage on the plateform after 2015. The current usage metrics is available 48-96 hours after online publication and is updated daily on week days.
Initial download of the metrics may take a while.