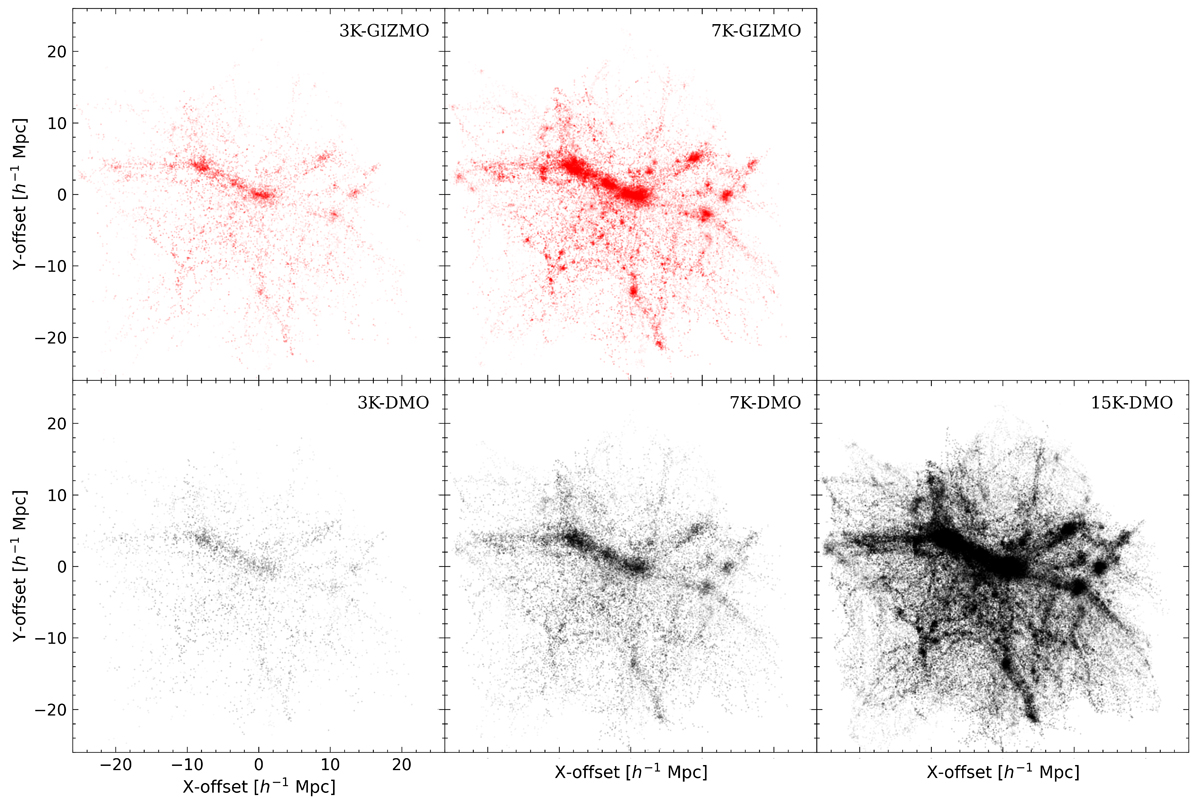
Fig. 1.

Download original image
X–Y projection of the entire region 310 in five different flavours depending mainly on the resolution and on the physics used to simulate the region. In the upper panels we show the region in the full-physics hydrodynamic simulations version and in the bottom panels we show the DMO simulations version. The red points represent the dark matter density distribution in the GIZMO simulations. Resolution increases from left to right panels: 3K, 7K, 15K (only DMO) on the left, centre, and right panels respectively.
Current usage metrics show cumulative count of Article Views (full-text article views including HTML views, PDF and ePub downloads, according to the available data) and Abstracts Views on Vision4Press platform.
Data correspond to usage on the plateform after 2015. The current usage metrics is available 48-96 hours after online publication and is updated daily on week days.
Initial download of the metrics may take a while.


