Fig. 7
Download original image
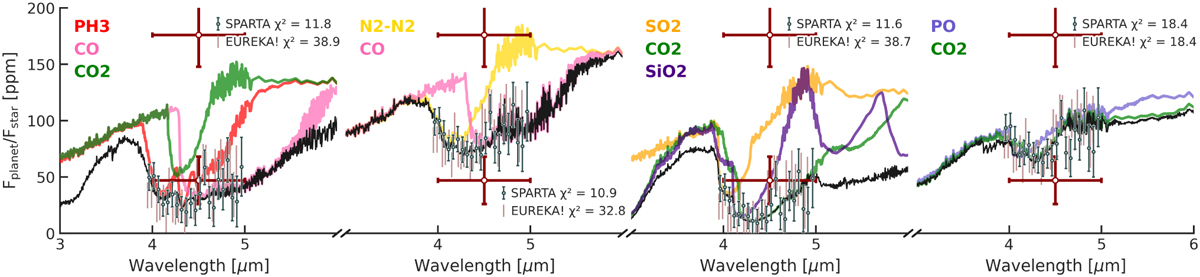
Comparison of the SPARTA and Eureka! reductions for the NIRCam spectrum from Hu et al. (2024). The dark grey data points represent SPARTA, while the light brown error bars are for Eureka!. Note that the SPARTA spectrum is lower resolution (21 points, versus 30 for Eureka!), which naturally results in lower χ2 values. The black spectrum is the total emission, with major absorbers highlighted in colour. Also shown in red is the low-flux Spitzer measurement from Demory et al. (2016b).
Current usage metrics show cumulative count of Article Views (full-text article views including HTML views, PDF and ePub downloads, according to the available data) and Abstracts Views on Vision4Press platform.
Data correspond to usage on the plateform after 2015. The current usage metrics is available 48-96 hours after online publication and is updated daily on week days.
Initial download of the metrics may take a while.