Fig. 4
Download original image
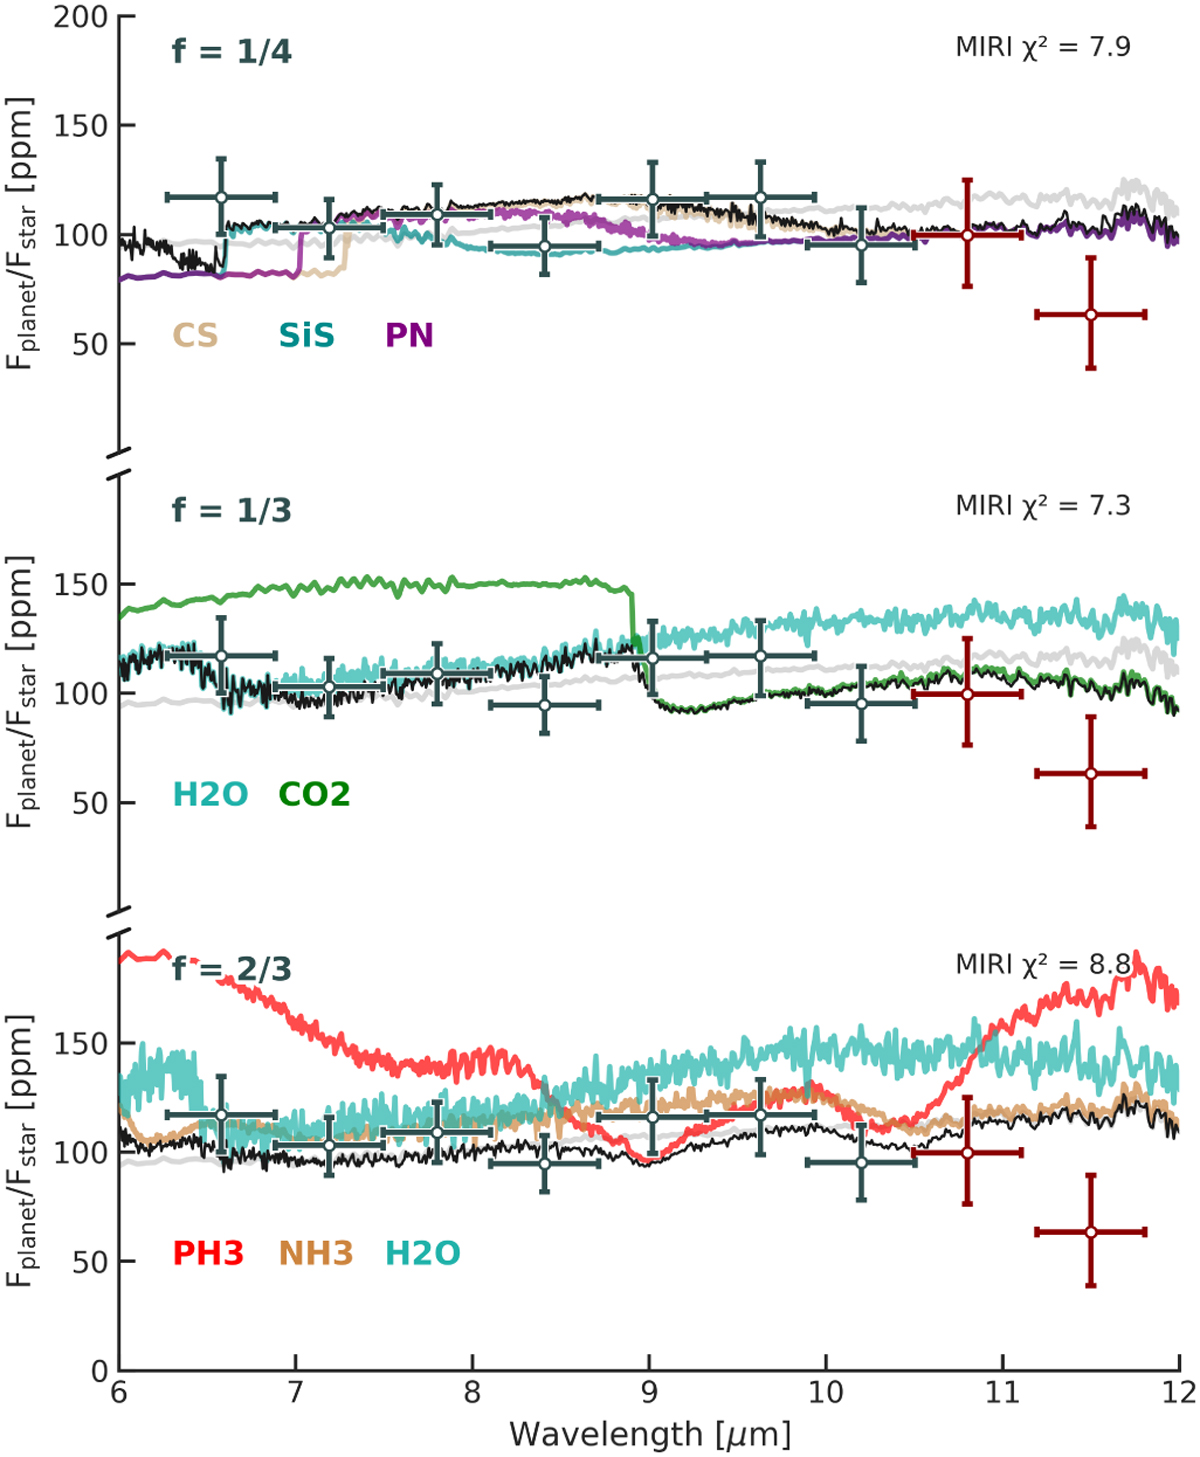
Emission spectra models for MIRI only. The shown data is the Eureka! reduction from Hu et al. (2024). Each panel represent a case for the denoted heat redistribution value f . The black spectrum is the total model, where the coloured spectra indicate individual contribution of opacities. Shown in grey are the best fitting blackbody spectra corresponding to a χ2 = 9.4. The two dark red data points are affected by the shadowing effect.
Current usage metrics show cumulative count of Article Views (full-text article views including HTML views, PDF and ePub downloads, according to the available data) and Abstracts Views on Vision4Press platform.
Data correspond to usage on the plateform after 2015. The current usage metrics is available 48-96 hours after online publication and is updated daily on week days.
Initial download of the metrics may take a while.