Fig. 7

Download original image
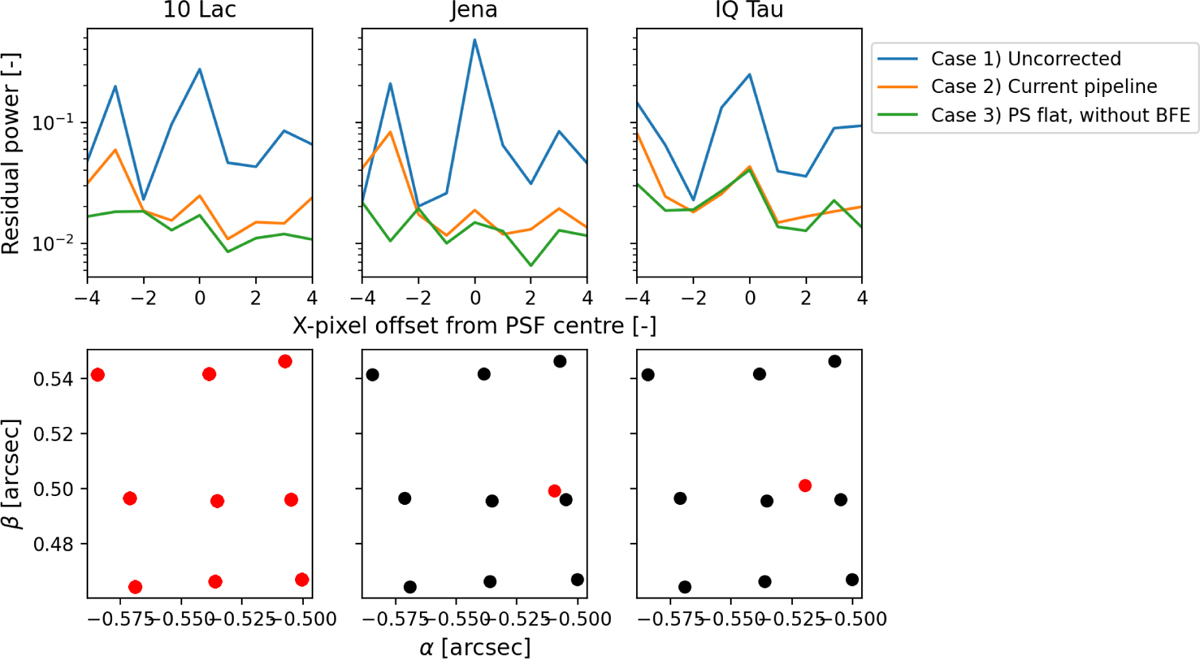
Mean residual power of the fringes in band 3A in the self-calibration case (10 Lac) and two red test cases (Jena and IQ Tau) for the four different test cases. In channels 3 and 4, where we did not derive BFE-corrected linearity corrections in Paper I, the BFE-corrected case is not included. The position of the observation (red) in detector coordinates α and β with respect to the grid points (black) is presented in the bottom row.
Current usage metrics show cumulative count of Article Views (full-text article views including HTML views, PDF and ePub downloads, according to the available data) and Abstracts Views on Vision4Press platform.
Data correspond to usage on the plateform after 2015. The current usage metrics is available 48-96 hours after online publication and is updated daily on week days.
Initial download of the metrics may take a while.


