Fig. 1
Download original image
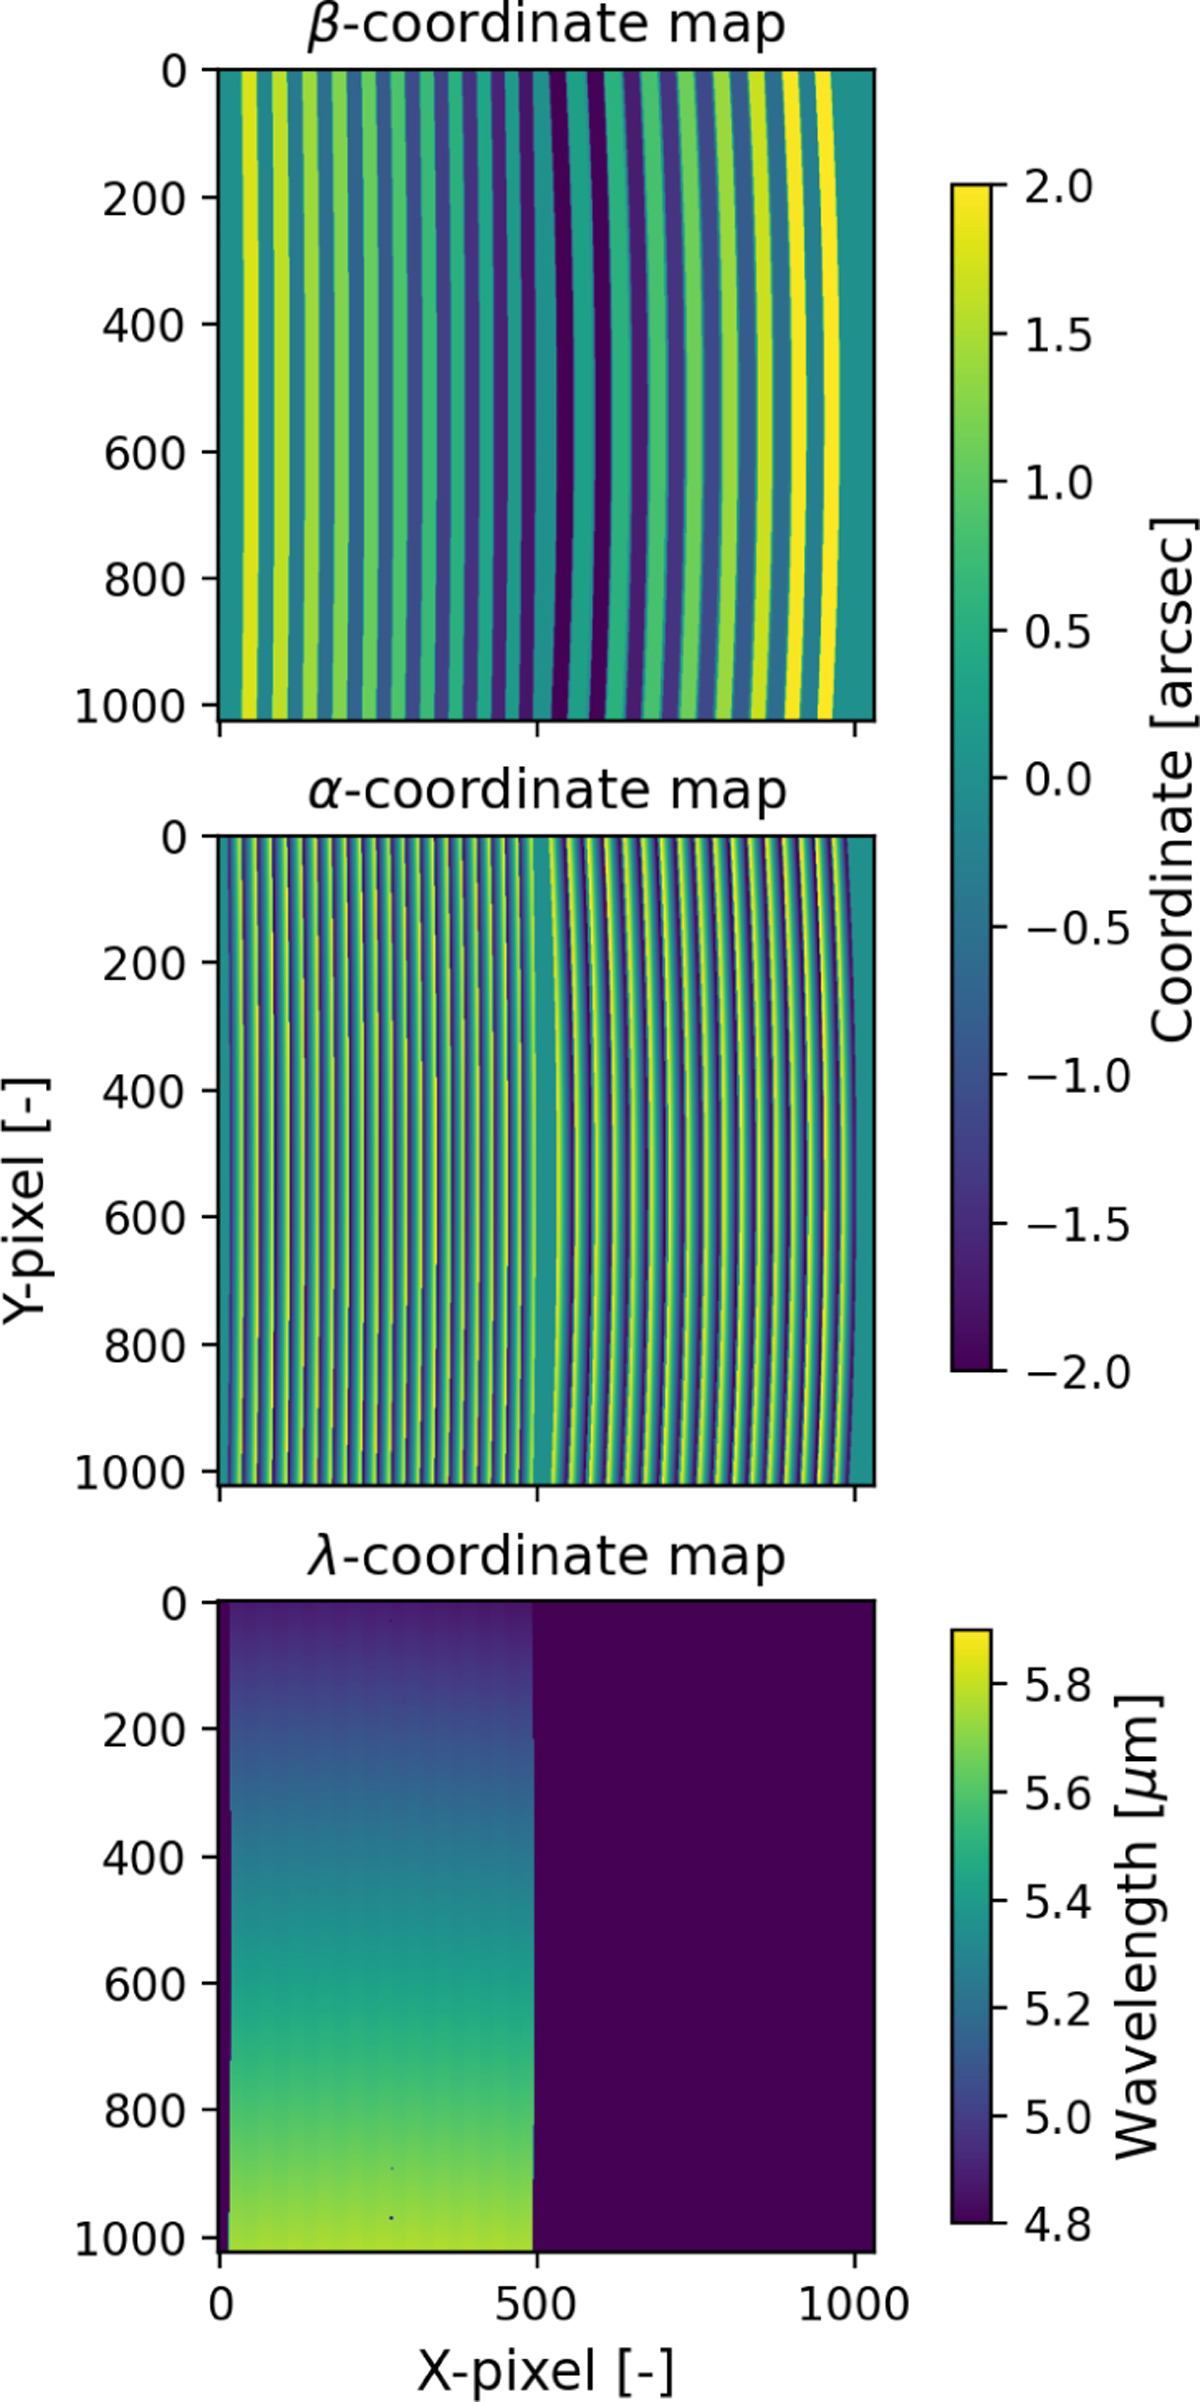
Example of detector coordinate maps for bands 1A (left half of the detector) and 2A (right half of the detector) of the β (top), α (middle), and λ (bottom) coordinates. α and β are analogous to on-sky RA and Dec coordinates. α is ‘along-slice’ on the image slicer and varies within a slice, β is perpendicular to this and varies per slice. The wavelength varies from top to bottom. Note that for the wavelength map we do not show the right half of the detector, since 2A is centred 3 μm further than 1A.
Current usage metrics show cumulative count of Article Views (full-text article views including HTML views, PDF and ePub downloads, according to the available data) and Abstracts Views on Vision4Press platform.
Data correspond to usage on the plateform after 2015. The current usage metrics is available 48-96 hours after online publication and is updated daily on week days.
Initial download of the metrics may take a while.