Fig. 7.
Download original image
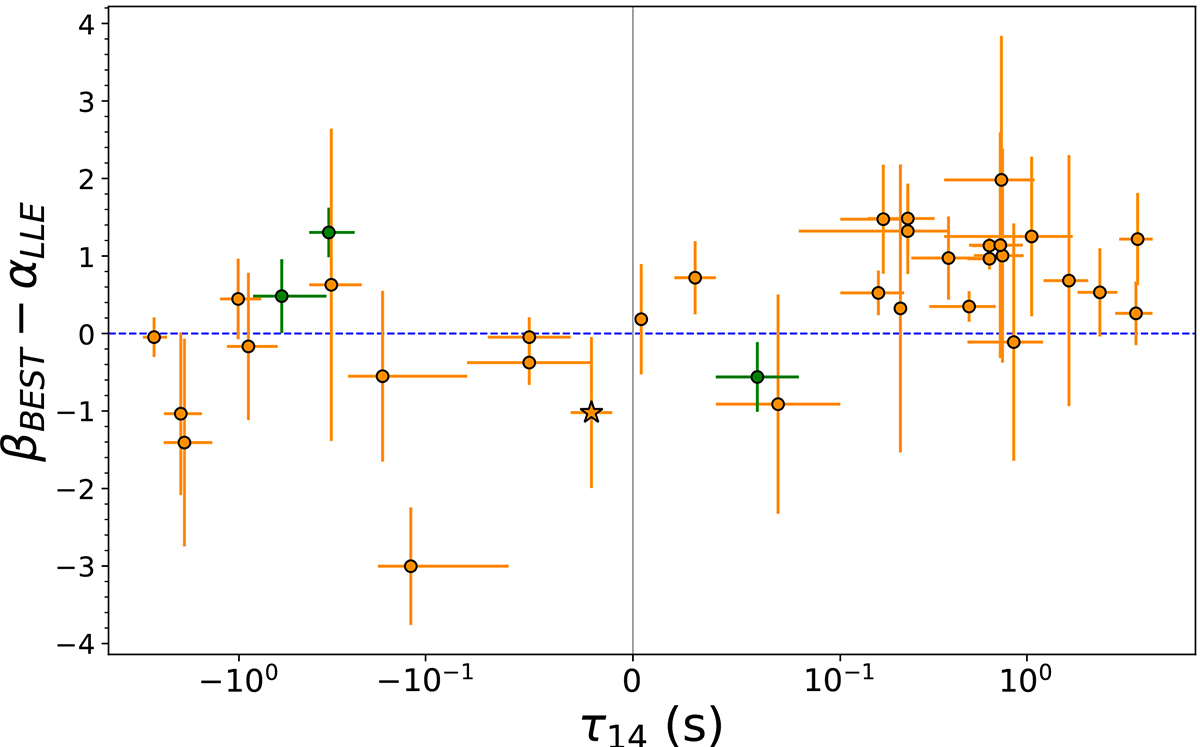
Difference between high-energy photon index of the GBM emission (βBEST) and the LLE photon index (αLLE) as a function of the spectral lag between Band 1 (GBM-NaI) and Band 4 (LAT-LLE) for 35 out of 70 GRBs in our sample. Short GRBs are indicated by stars. Green points represent GRBs that deviate from the expected trend, corresponding to GRBs 100724B, 100826A and 131108A. The dashed-blue line represent the arbitrary threshold between hard and soft spectra in the framework of the phenomenological scenario described in Section 7. Spectral lags τ are reported in symmetric-logarithmic scale for visualization purpose.
Current usage metrics show cumulative count of Article Views (full-text article views including HTML views, PDF and ePub downloads, according to the available data) and Abstracts Views on Vision4Press platform.
Data correspond to usage on the plateform after 2015. The current usage metrics is available 48-96 hours after online publication and is updated daily on week days.
Initial download of the metrics may take a while.