Fig. 5.
Download original image
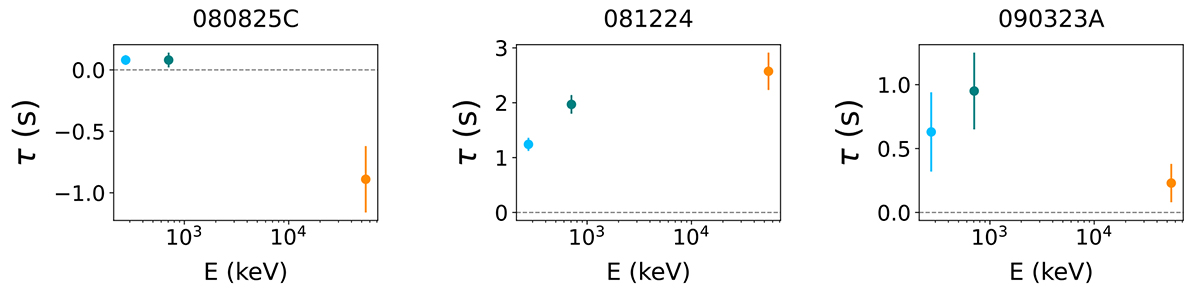
τ12 (blue point) τ13 (green point) and τ14 (orange point) lags as a function of the mean energy of the respective channel. Each plot represents an example of GRB which show one characteristic trend of the time lag versus energy. From left to right: transition from positive values of τ12 and τ13 to negative τ14 values, increasing time lag with energy and an example of a more hybrid, scattered trend.
Current usage metrics show cumulative count of Article Views (full-text article views including HTML views, PDF and ePub downloads, according to the available data) and Abstracts Views on Vision4Press platform.
Data correspond to usage on the plateform after 2015. The current usage metrics is available 48-96 hours after online publication and is updated daily on week days.
Initial download of the metrics may take a while.