Fig. 4.
Download original image
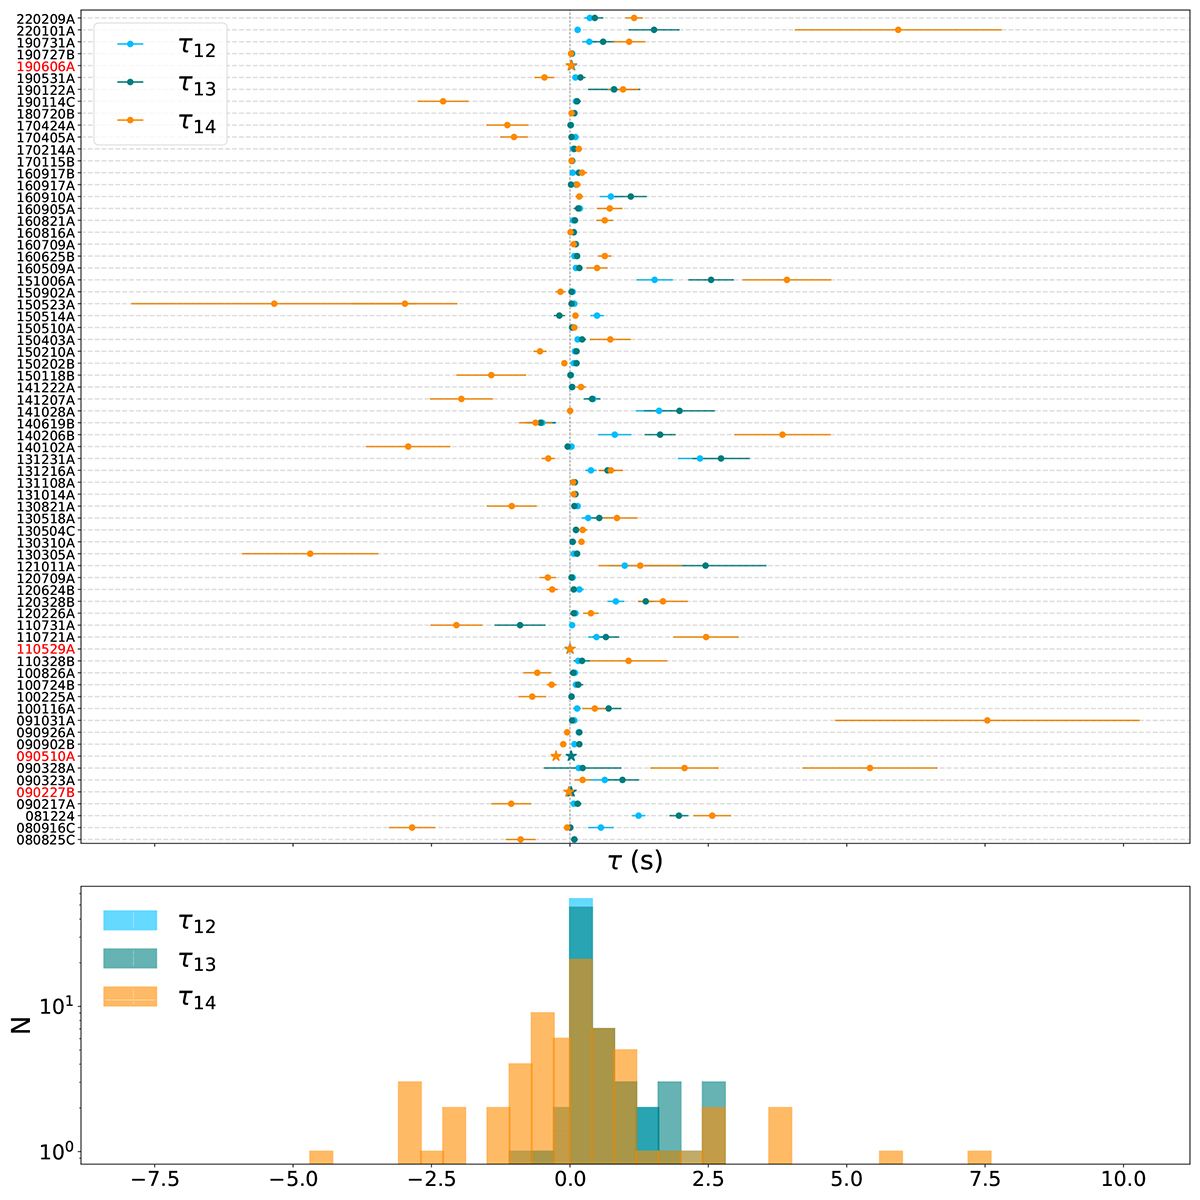
Spectral lags for the 70 GRBs in our sample. Upper panel: lags between Band 1 and Band 2 (τ12, blue points), Band 3 (τ13, green points) and Band 4 (τ14, orange points) and their 1σ uncertainties (listed in Table A.1). Short GRBs are marked with star symbols and their names are in red color. Spectral lags τ values are represented in symmetric-logarithmic scale for visualization purposes. Lower panel: distributions of spectral lag values.
Current usage metrics show cumulative count of Article Views (full-text article views including HTML views, PDF and ePub downloads, according to the available data) and Abstracts Views on Vision4Press platform.
Data correspond to usage on the plateform after 2015. The current usage metrics is available 48-96 hours after online publication and is updated daily on week days.
Initial download of the metrics may take a while.