Fig. 3.
Download original image
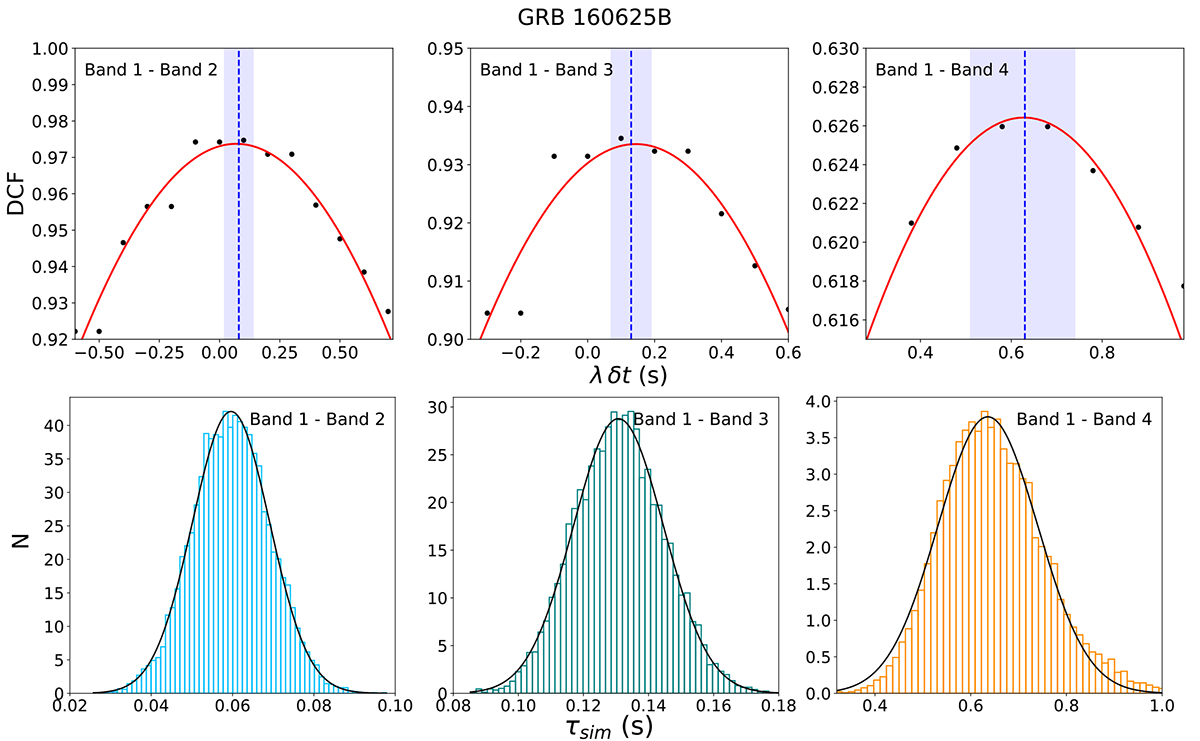
Lag computation for GRB 160625B. Upper panel: DCF as a function of the time delay (in seconds – bins of 0.1 s) between Band 1 (10–100 keV) background-subtracted light curve and those of Band 2 (150–500 keV) (left plot), Band 3 (500 keV–1 MeV) (central plot) and Band 4 (30–100 MeV) (right plot). In each plot the red line represents the best fit to the DCF with an asymmetric Gaussian model. Blue-dashed lines mark the maximum of the asymmetric Gaussian model, while colored areas mark its 1σ uncertainty. The latter is estimated through Monte Carlo simulations of GRB 160625B time lags (bottom panels). From left to right: distribution of 10 000 synthetic τ12, τ13 and τ14 spectral lags obtained through a flux-randomization method. The black lines show the best fit with a symmetric Gaussian. The mean value and the standard deviation of each Gaussian represent the best value of the spectral lag and its corresponding 1σ uncertainty.
Current usage metrics show cumulative count of Article Views (full-text article views including HTML views, PDF and ePub downloads, according to the available data) and Abstracts Views on Vision4Press platform.
Data correspond to usage on the plateform after 2015. The current usage metrics is available 48-96 hours after online publication and is updated daily on week days.
Initial download of the metrics may take a while.