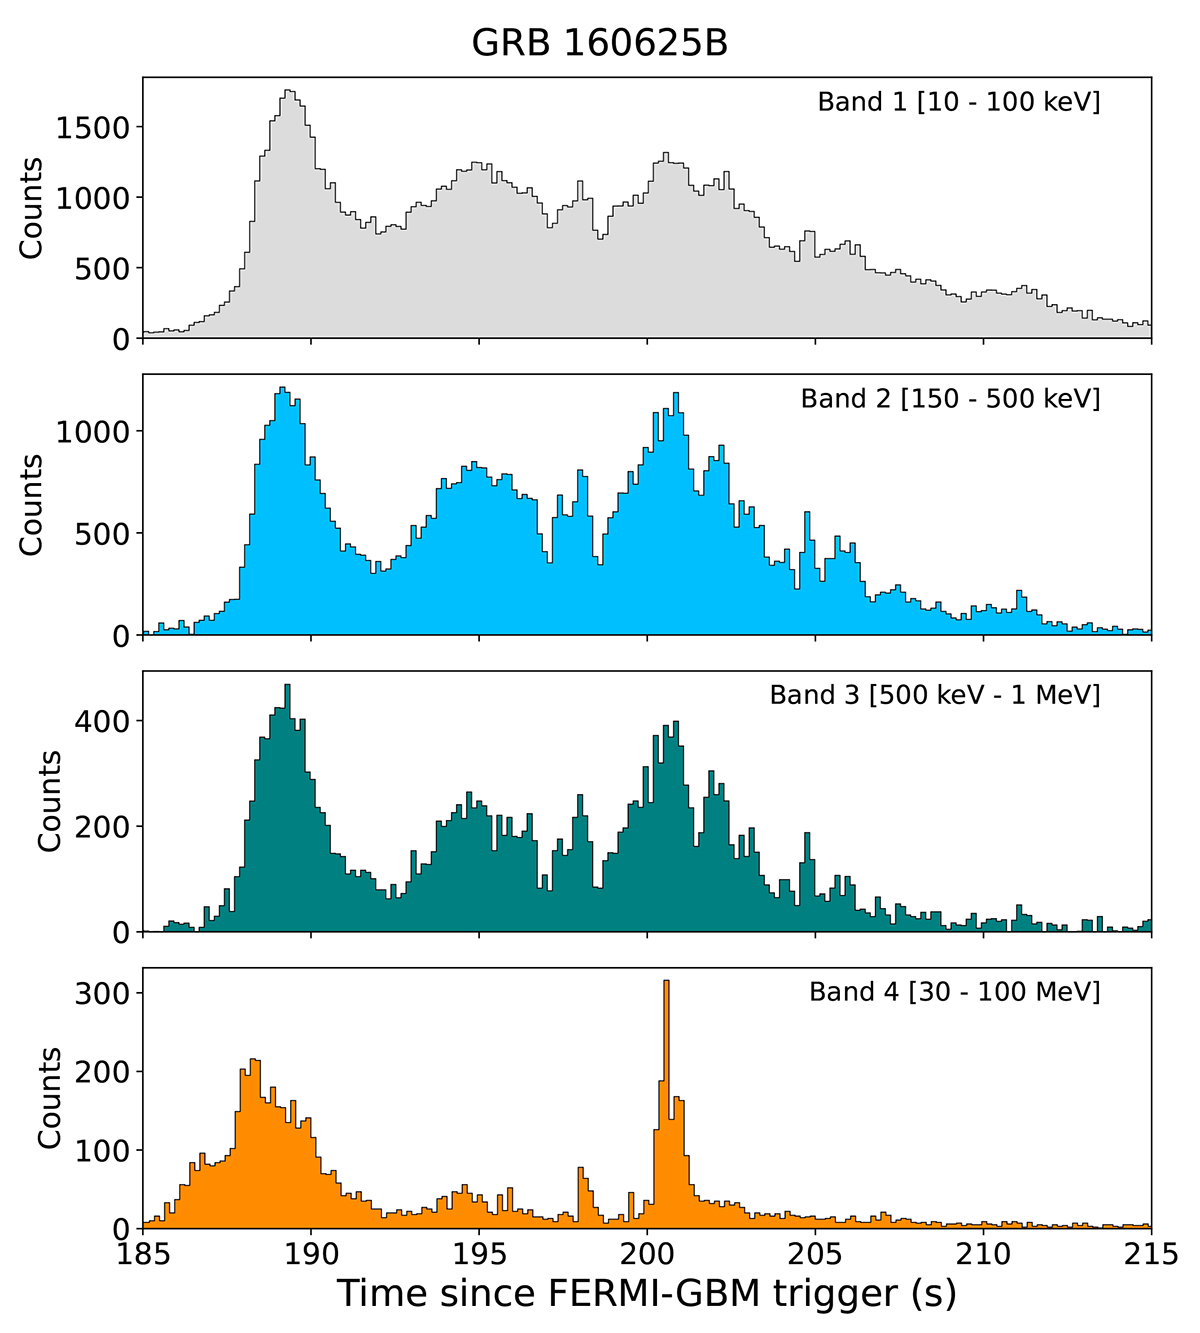
Fig. 2.
Download original image
Light curves of GRB 160625B. From top to bottom: Band 1 (10 – 100 keV), Band 2 (150 keV – 500 keV), Band 3 (500 keV – 1 MeV), and Band 4 (30 MeV – 100 MeV) background-subtracted light curves, binned at 0.1 s. The time interval adopted for the cross-correlation is [185.0, 215.0] s, which accounts for the presence of a burst precursor, with the main emission episode being delayed by ∼185 sec with respect to the trigger time.
Current usage metrics show cumulative count of Article Views (full-text article views including HTML views, PDF and ePub downloads, according to the available data) and Abstracts Views on Vision4Press platform.
Data correspond to usage on the plateform after 2015. The current usage metrics is available 48-96 hours after online publication and is updated daily on week days.
Initial download of the metrics may take a while.