Open Access
Fig. B.4.
Download original image
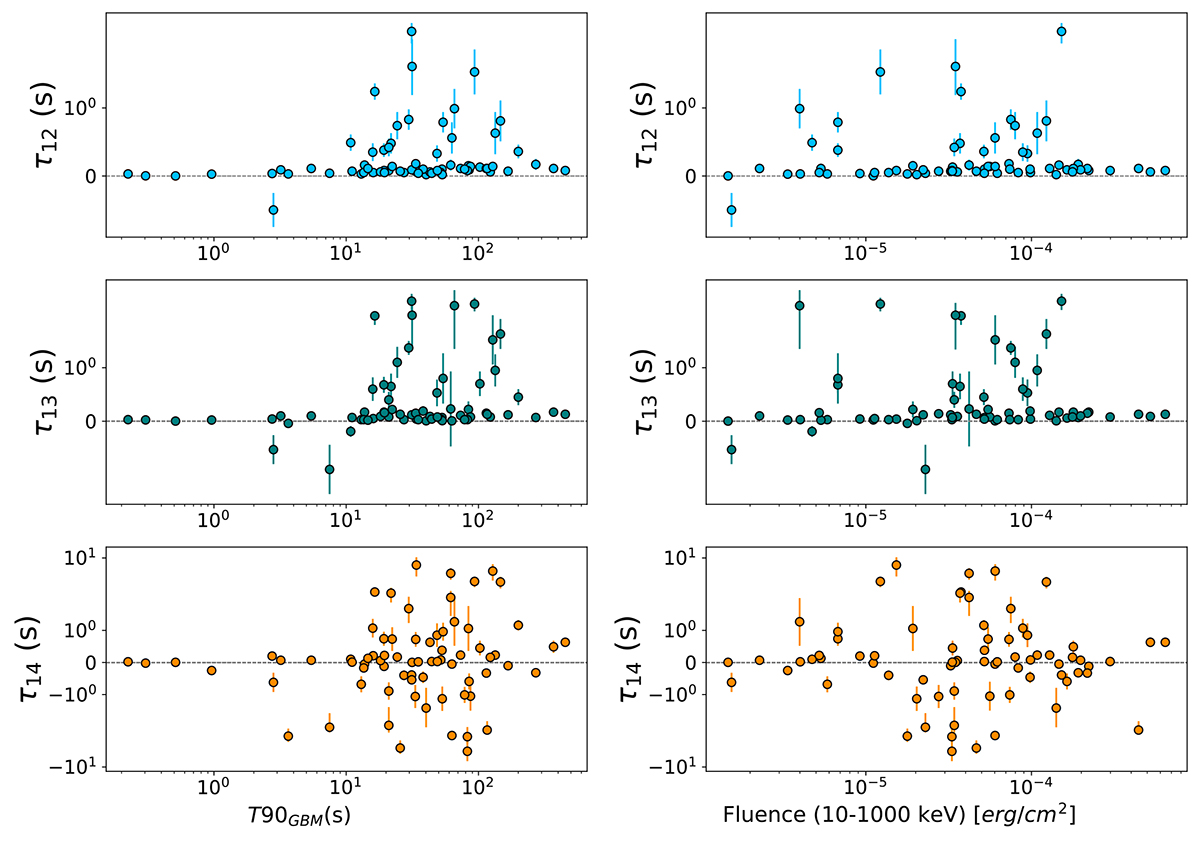
Spectral lags as a function of the duration of the burst as seen by the GBM detector (left panel) and of the respective fluence (right panel). From top to bottom : Band 1 – Band 2 (blue points), Band 1 – Band 3 (green points), and Band 1 – Band 4 (orange points) spectral lags.
Current usage metrics show cumulative count of Article Views (full-text article views including HTML views, PDF and ePub downloads, according to the available data) and Abstracts Views on Vision4Press platform.
Data correspond to usage on the plateform after 2015. The current usage metrics is available 48-96 hours after online publication and is updated daily on week days.
Initial download of the metrics may take a while.