Fig. 1.
Download original image
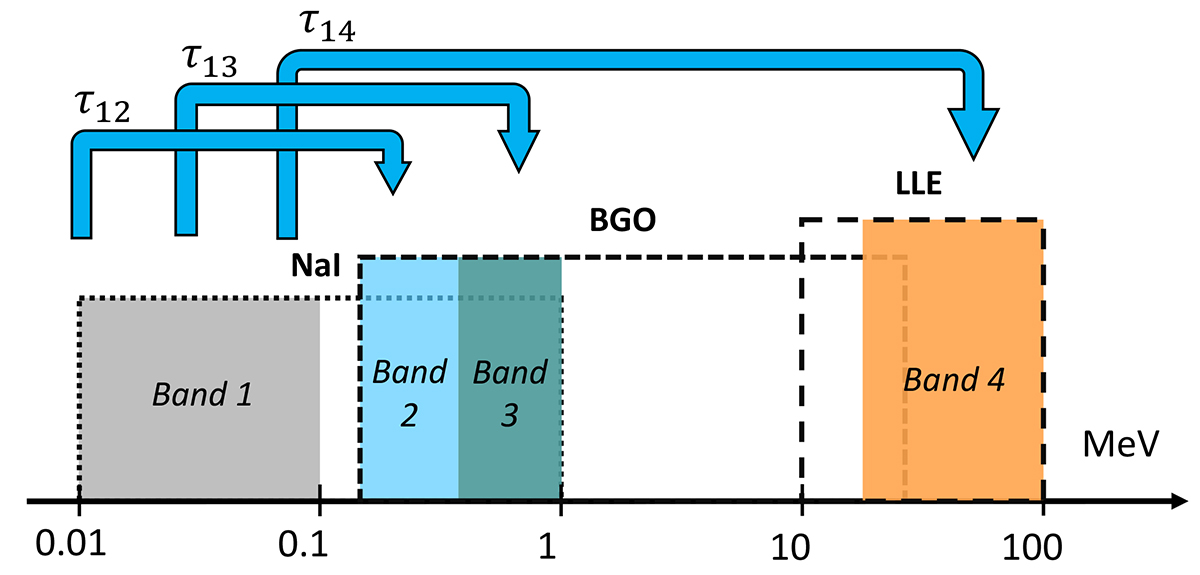
Representation of the four energy ranges considered for the computation of spectral lags (shaded filled regions). Blocks defined by long and short dashed and dotted lines represent the full energy range of each Fermi detector (as labeled). For each GRB in the sample, the light curve extracted in Band 1 (10–100 keV) is cross-correlated (blue arrows) with those obtained in Band 2 (150–500 keV), Band 3 (500 keV–1 MeV), and Band 4 (30–100 MeV) in order to obtain the corresponding lags τ12, τ13 and τ14.
Current usage metrics show cumulative count of Article Views (full-text article views including HTML views, PDF and ePub downloads, according to the available data) and Abstracts Views on Vision4Press platform.
Data correspond to usage on the plateform after 2015. The current usage metrics is available 48-96 hours after online publication and is updated daily on week days.
Initial download of the metrics may take a while.