Fig. 5
Download original image
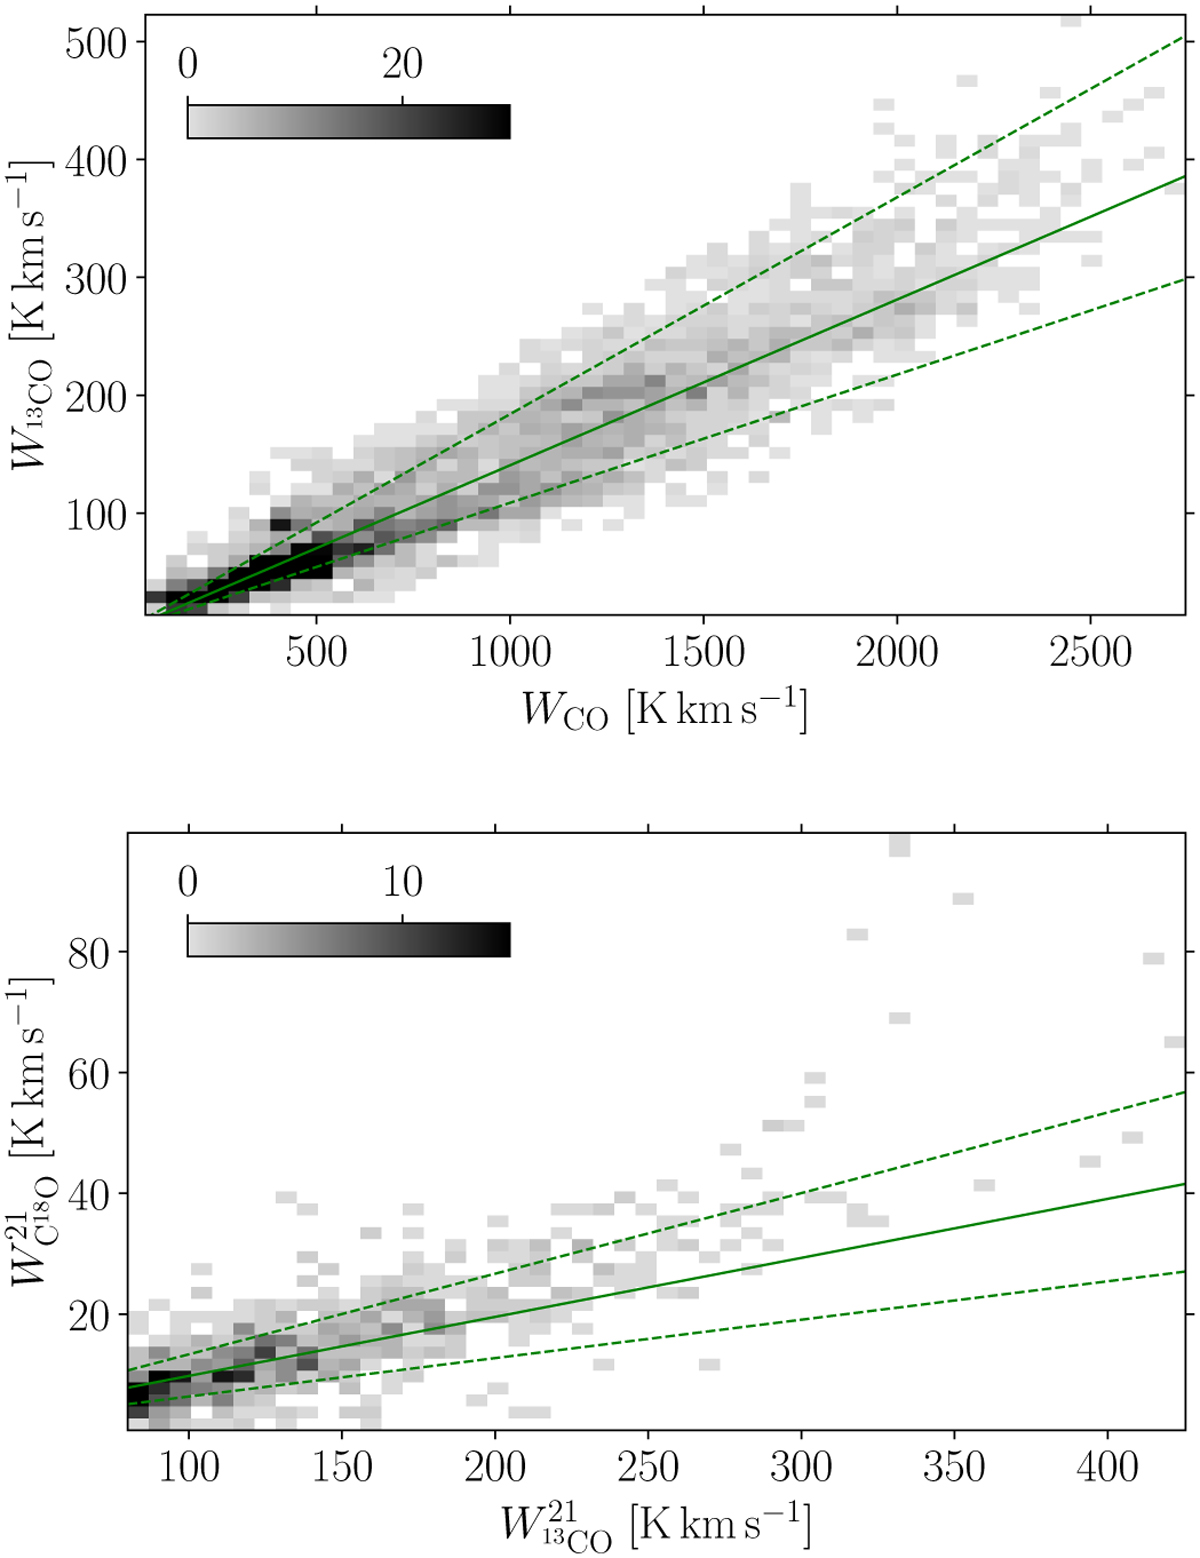
Top: integrated line intensities of 13CO versus 12CO isotopes for the (1–0) transition. Bottom: integrated CO line intensities of the C18O versus 13CO isotopes for the (2–1) transition. Green full lines correspond to linear relation for which the slope is the median WCO ratio; dashed lines give 1σ errors from the 16 and 84 percentiles.
Current usage metrics show cumulative count of Article Views (full-text article views including HTML views, PDF and ePub downloads, according to the available data) and Abstracts Views on Vision4Press platform.
Data correspond to usage on the plateform after 2015. The current usage metrics is available 48-96 hours after online publication and is updated daily on week days.
Initial download of the metrics may take a while.