Fig. A.1
Download original image
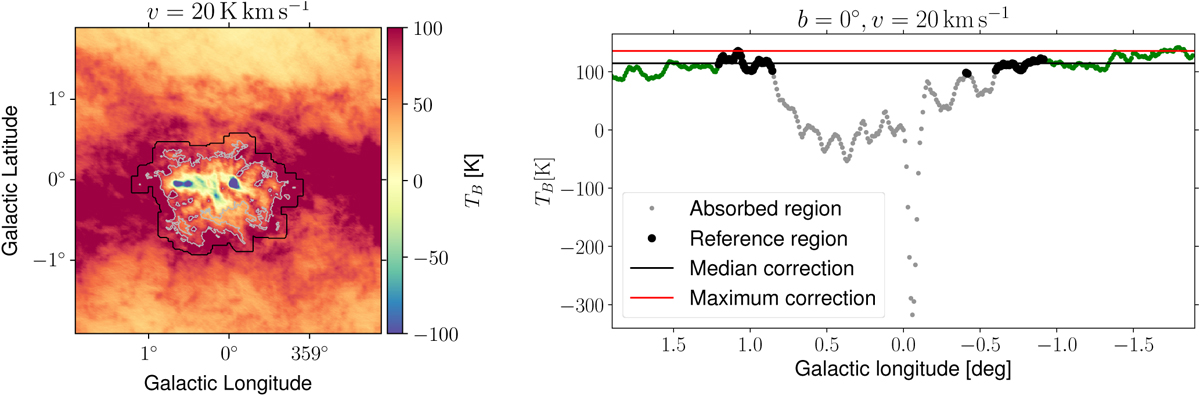
Left: H I temperature brightness at v = 20 km s−1. Grey contours delimit the regions we consider affected by absorption (because of low temperature brightness and large gradient values). Black contours correspond to a 10 pixels margin around the grey contours that we use as reference region to compute the median or maximum values in the vicinity. Right: H I temperature brightness at v = 20 km s−1 and b = 0°. The median and maximum values are computed along each longitude value considering only the reference pixels (black) and used as substitute for the absorbed pixels (grey). The same operation is applied for each velocity independently. More details are given is the text of Sect. 2.1.1, and the resulting NH maps are shown in Fig. A.2.
Current usage metrics show cumulative count of Article Views (full-text article views including HTML views, PDF and ePub downloads, according to the available data) and Abstracts Views on Vision4Press platform.
Data correspond to usage on the plateform after 2015. The current usage metrics is available 48-96 hours after online publication and is updated daily on week days.
Initial download of the metrics may take a while.