Open Access
Fig. 14
Download original image
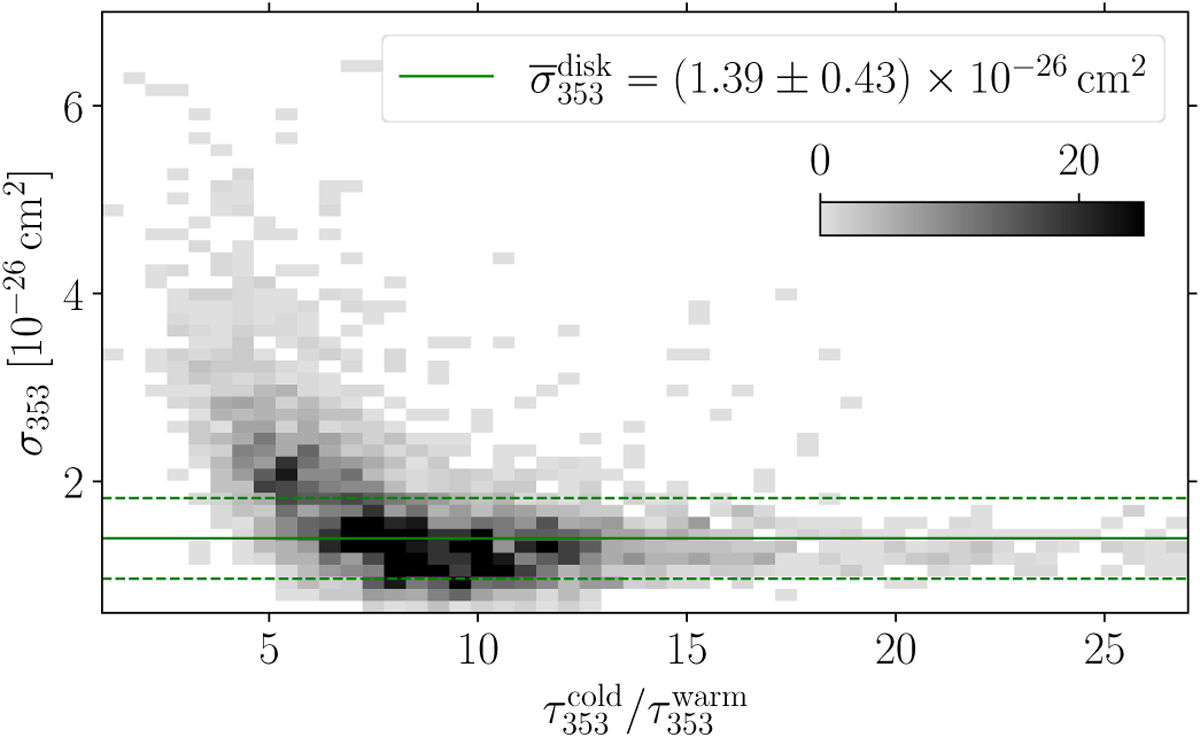
Dust opacity as a function of the cold to warm component ratio in dust optical depth, ![]() . The green line corresponds to the mean opacity in the regions dominated by the disk gas (fdisk > 0.5) which mostly correspond to regions dominated by atomic gas.
. The green line corresponds to the mean opacity in the regions dominated by the disk gas (fdisk > 0.5) which mostly correspond to regions dominated by atomic gas.
Current usage metrics show cumulative count of Article Views (full-text article views including HTML views, PDF and ePub downloads, according to the available data) and Abstracts Views on Vision4Press platform.
Data correspond to usage on the plateform after 2015. The current usage metrics is available 48-96 hours after online publication and is updated daily on week days.
Initial download of the metrics may take a while.