Open Access
Fig. 12
Download original image
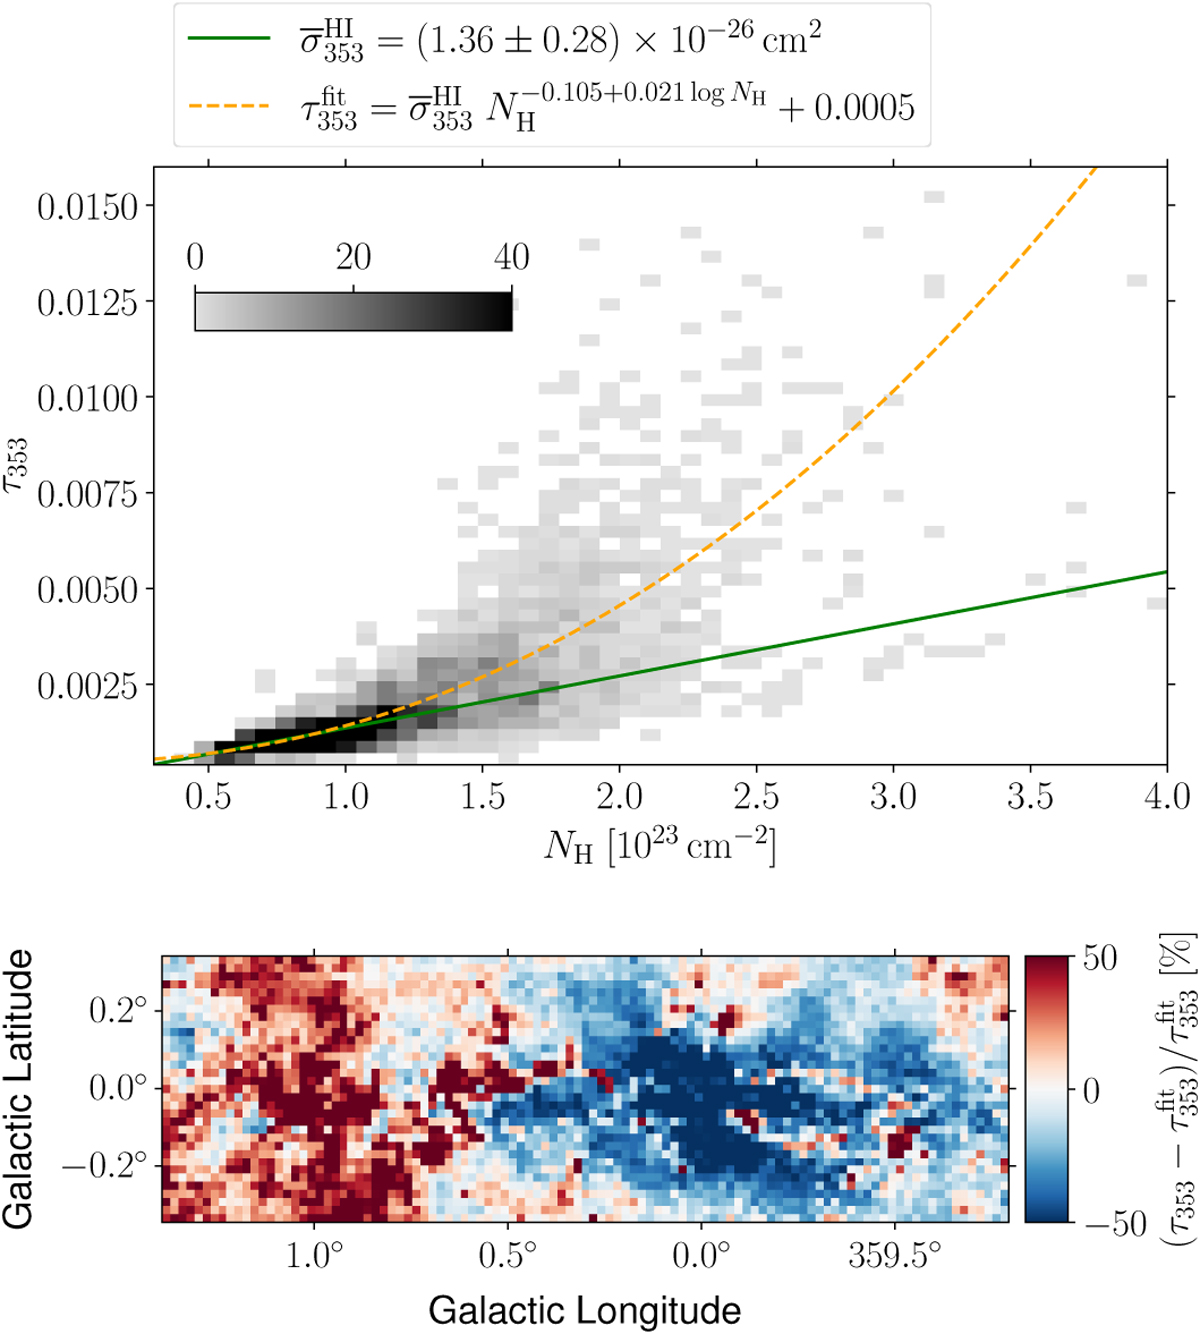
Top: dust optical depth as a function of NH. The green line corresponds to a linear relation for which the slope is the mean opacity in the regions dominated by atomic gas (fH2 < 0.5). The orange curve corresponds to the best-fit τ353 as a function of NH with a log-parabola model. Bottom: relative error on the fit.
Current usage metrics show cumulative count of Article Views (full-text article views including HTML views, PDF and ePub downloads, according to the available data) and Abstracts Views on Vision4Press platform.
Data correspond to usage on the plateform after 2015. The current usage metrics is available 48-96 hours after online publication and is updated daily on week days.
Initial download of the metrics may take a while.