Fig. 3
Download original image
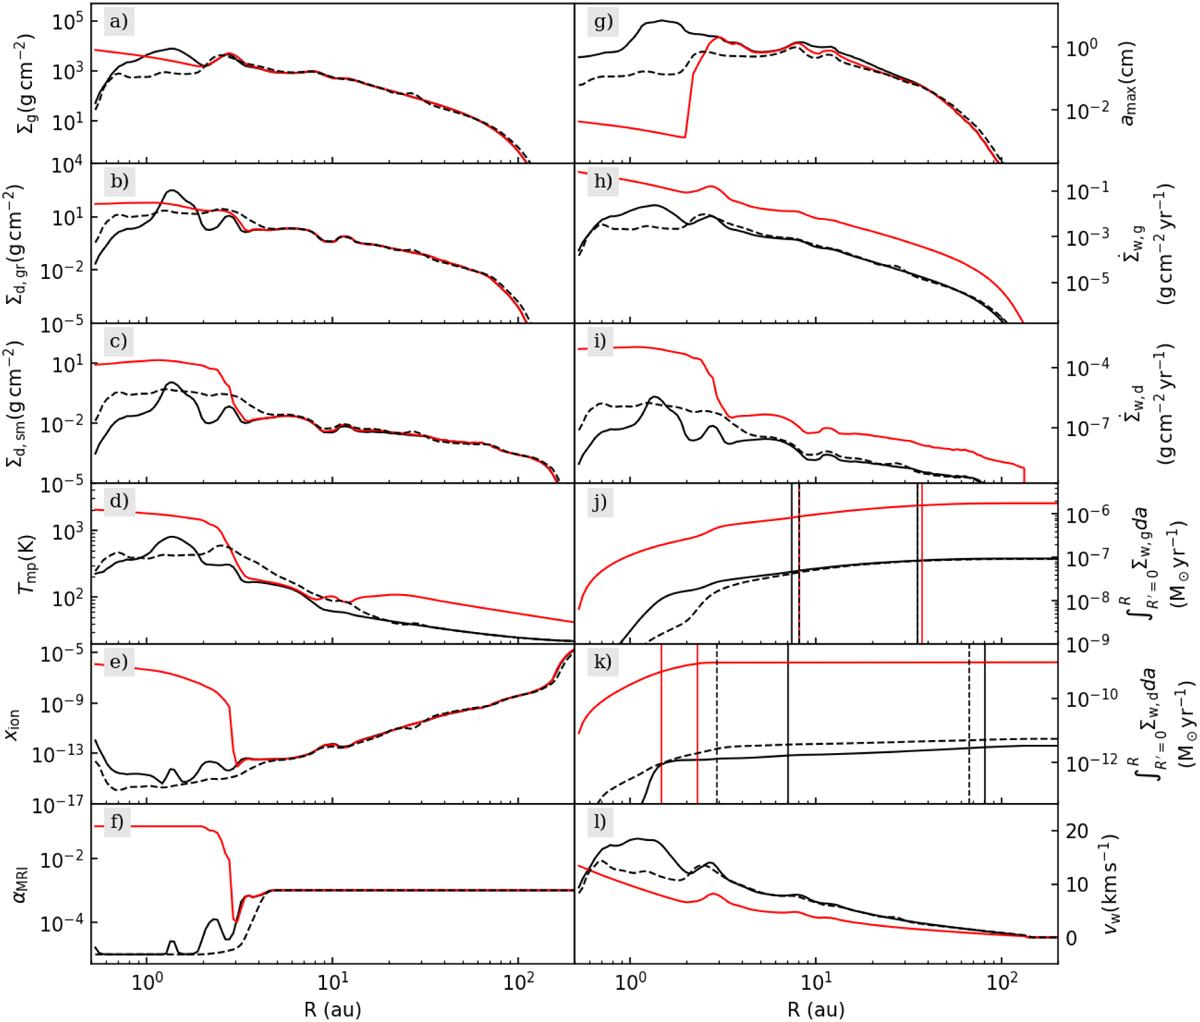
Evolution of some of the azimuthally averaged quantities across an outburst, showing before (solid black), during (solid red) and after (dashed black) profiles. The selected phases for this plot are marked in Fig. 2. The vertical lines in panels j and k correspond to the region which contains 50% and 90% of the total cumulative mass-loss rates, with the same color coding.
Current usage metrics show cumulative count of Article Views (full-text article views including HTML views, PDF and ePub downloads, according to the available data) and Abstracts Views on Vision4Press platform.
Data correspond to usage on the plateform after 2015. The current usage metrics is available 48-96 hours after online publication and is updated daily on week days.
Initial download of the metrics may take a while.