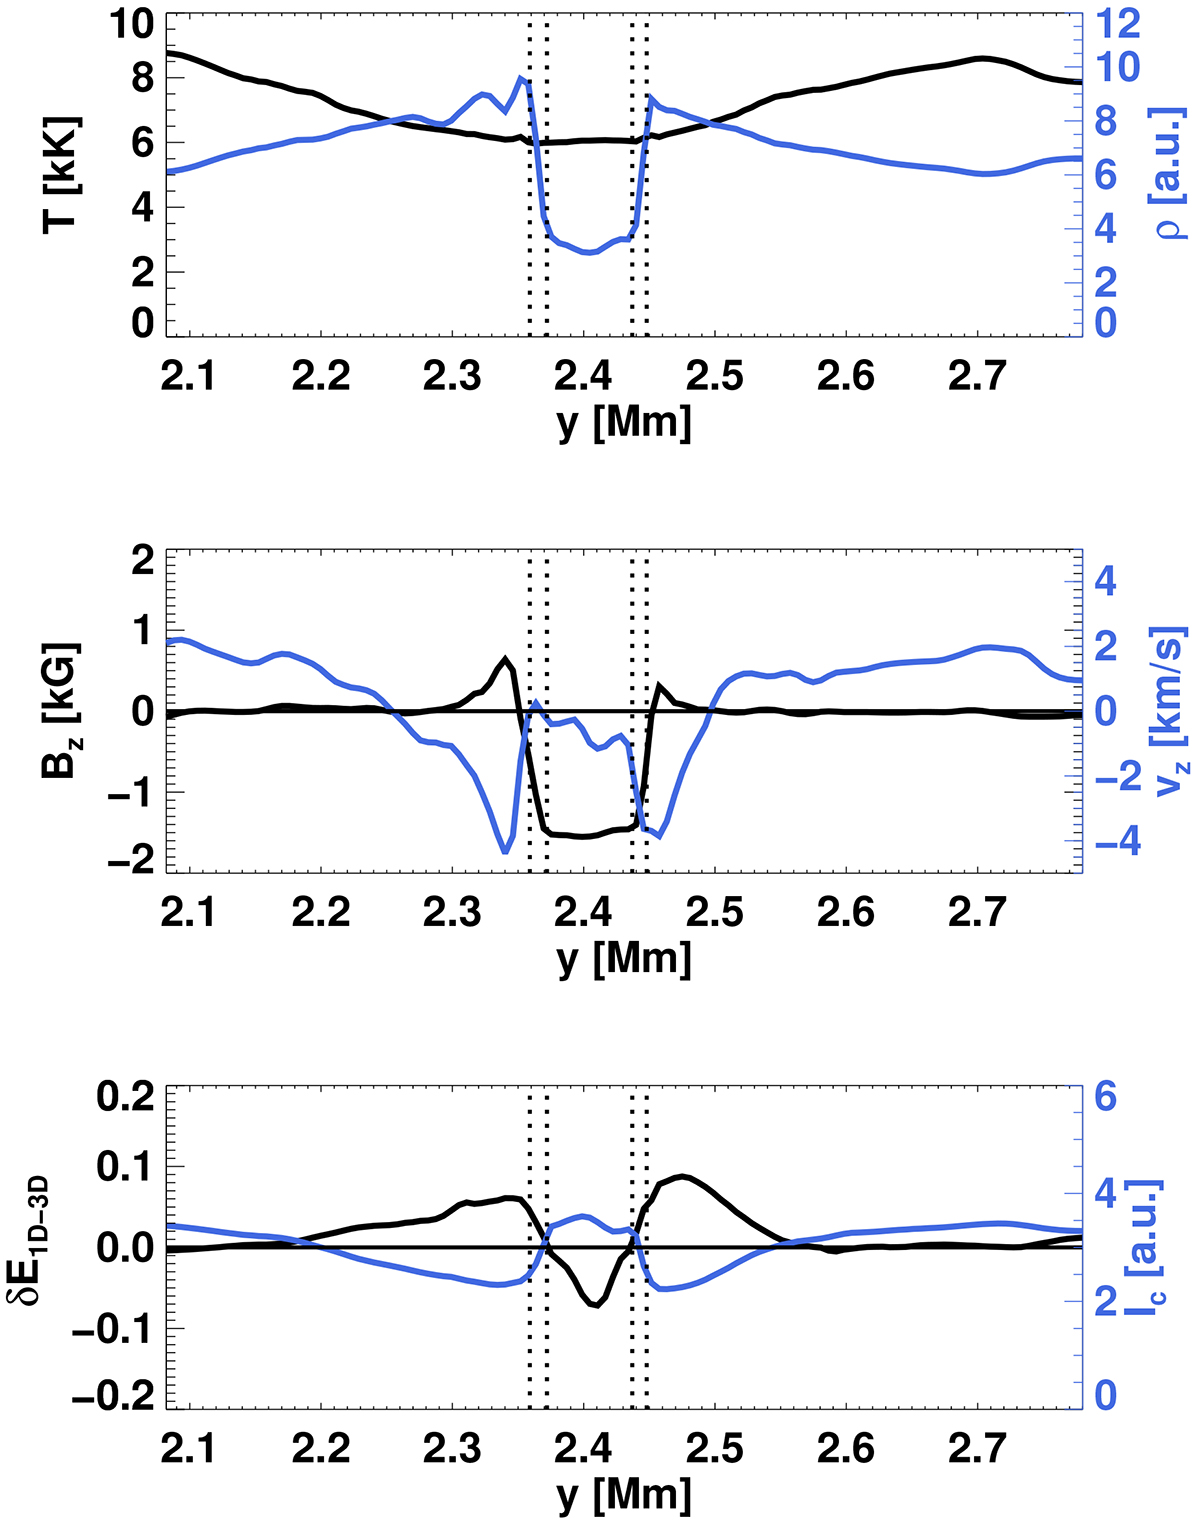
Fig. 6.
Download original image
Selected quantities along a cut through a FS indicated in Figure 5. Top panel: Temperature (black) and density (blue). Middle panel: Vertical magnetic field (black) and vertical velocity (blue, negative values denote downflows). Bottom panel: δE1D − 3D (black) and continuum intensity, Ic (blue). All the quantities were taken at a geometrical height of z = 0 km. The vertical dotted lines indicate the boundary region of the flux element over which the density decreases and the magnetic field increases.
Current usage metrics show cumulative count of Article Views (full-text article views including HTML views, PDF and ePub downloads, according to the available data) and Abstracts Views on Vision4Press platform.
Data correspond to usage on the plateform after 2015. The current usage metrics is available 48-96 hours after online publication and is updated daily on week days.
Initial download of the metrics may take a while.