Fig. 5.
Download original image
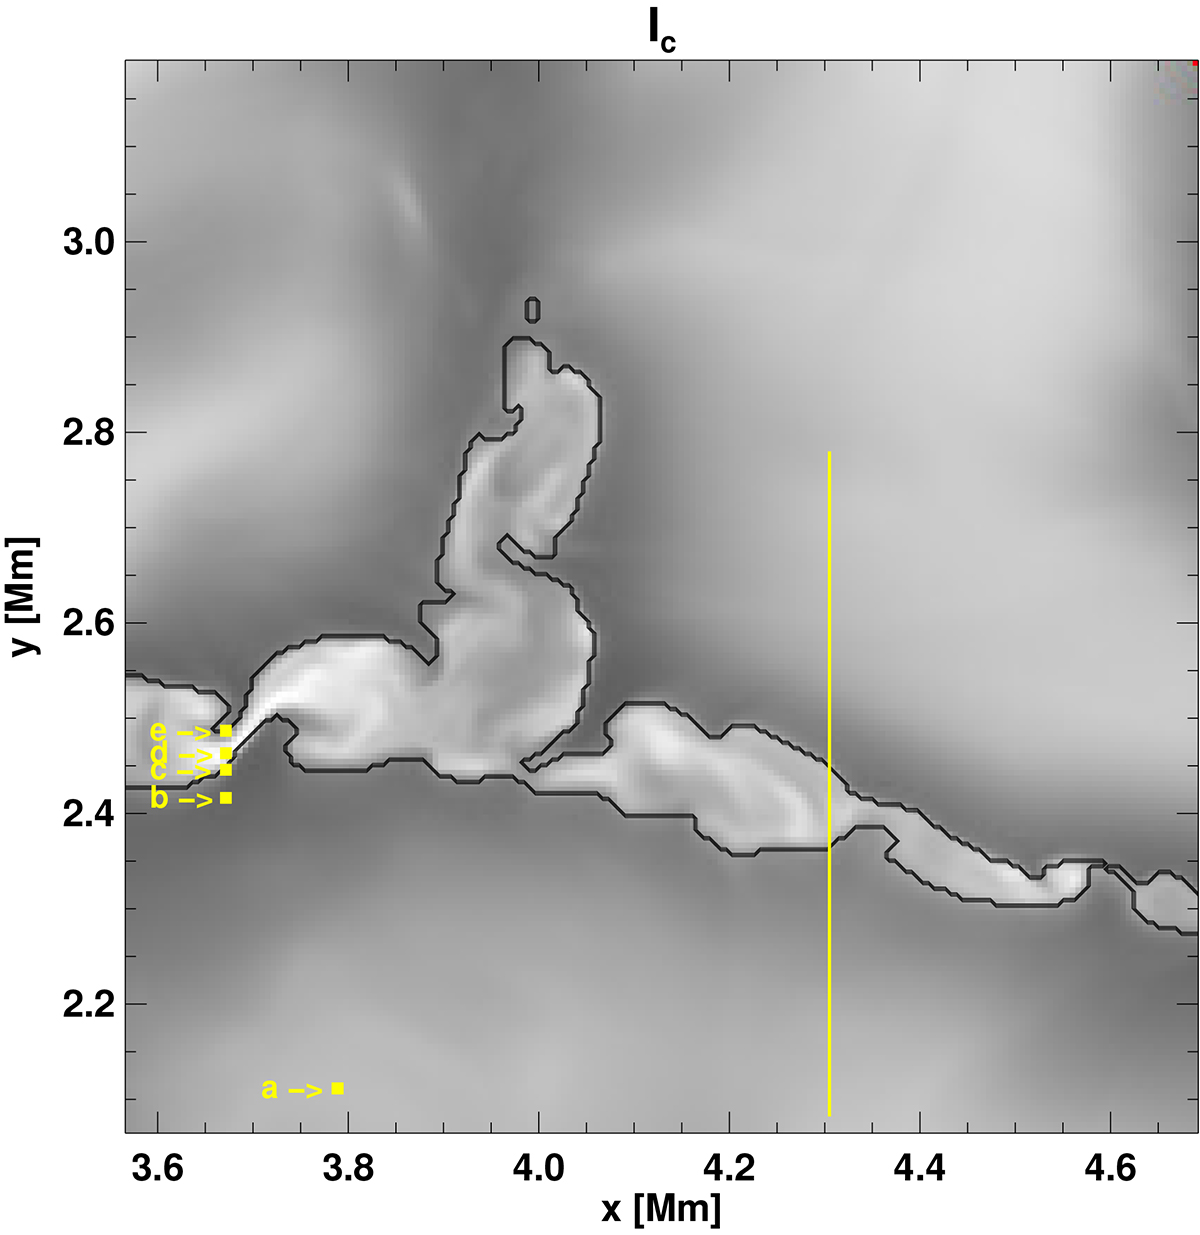
Enlarged section (≈1 Mm × 1 Mm) of the continuum intensity image (Figure 2) showing the part of the atmosphere where the 3D NLTE calculation was performed. The yellow line and the five yellow dots (a–e) indicate selected positions used in the text for further analysis. The yellow dots were drawn larger (2 × 2) than in the actual image for better visibility. The black contours indicate the boundary of the magnetic element corresponding roughly to Bz(z = 0) = 1200 G.
Current usage metrics show cumulative count of Article Views (full-text article views including HTML views, PDF and ePub downloads, according to the available data) and Abstracts Views on Vision4Press platform.
Data correspond to usage on the plateform after 2015. The current usage metrics is available 48-96 hours after online publication and is updated daily on week days.
Initial download of the metrics may take a while.