Fig. 4.
Download original image
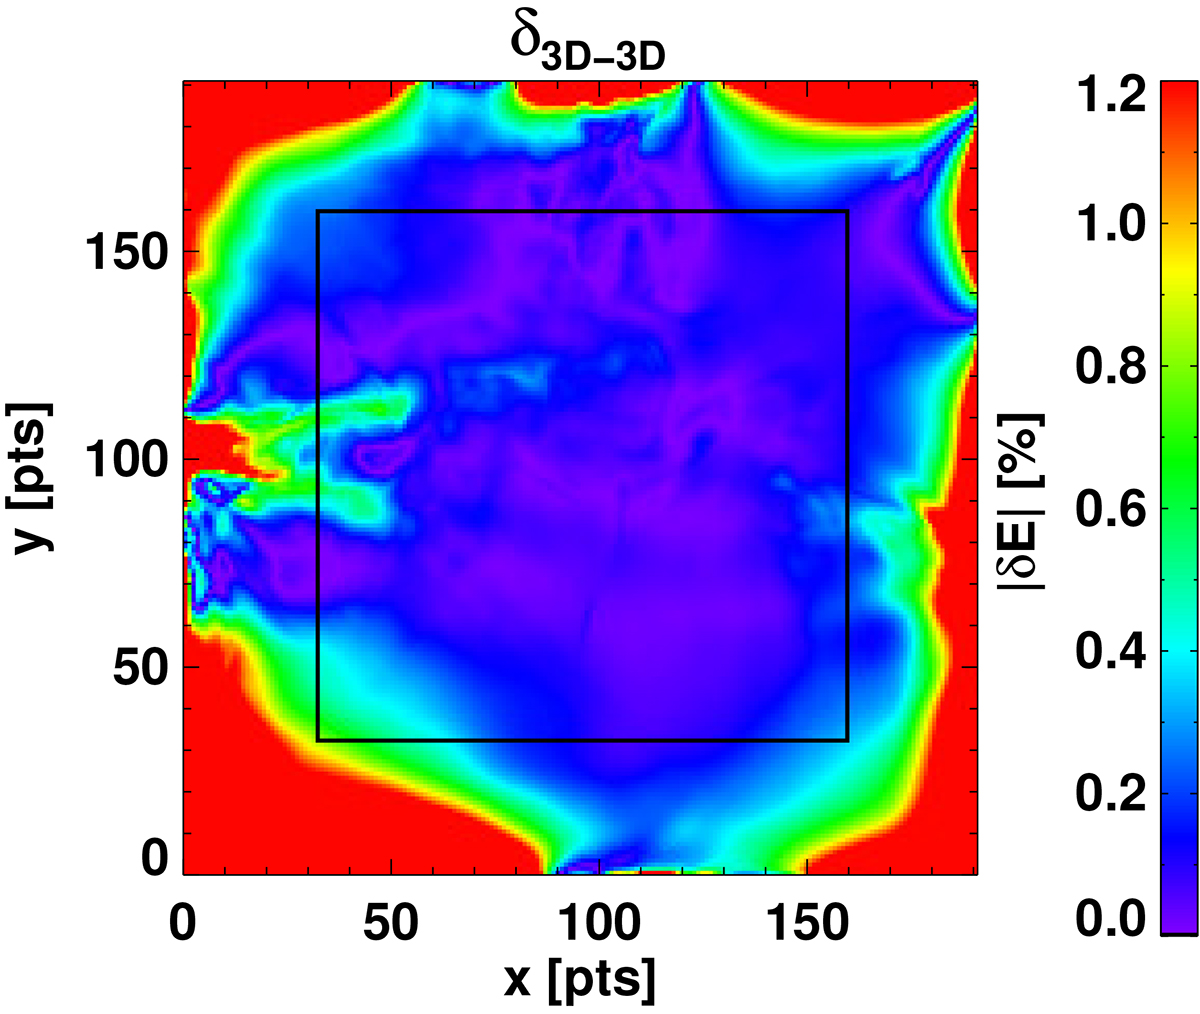
Spatial distribution of the relative differences between the EW values of the Fe I 630.15 nm spectral line calculated in the two spatially shifted sub-domains in 3D NLTE. The colours denote the deviation in the EW between the two runs. The rectangle indicates the area chosen for our investigation, which lies completely inside the region with less than 1% difference.
Current usage metrics show cumulative count of Article Views (full-text article views including HTML views, PDF and ePub downloads, according to the available data) and Abstracts Views on Vision4Press platform.
Data correspond to usage on the plateform after 2015. The current usage metrics is available 48-96 hours after online publication and is updated daily on week days.
Initial download of the metrics may take a while.