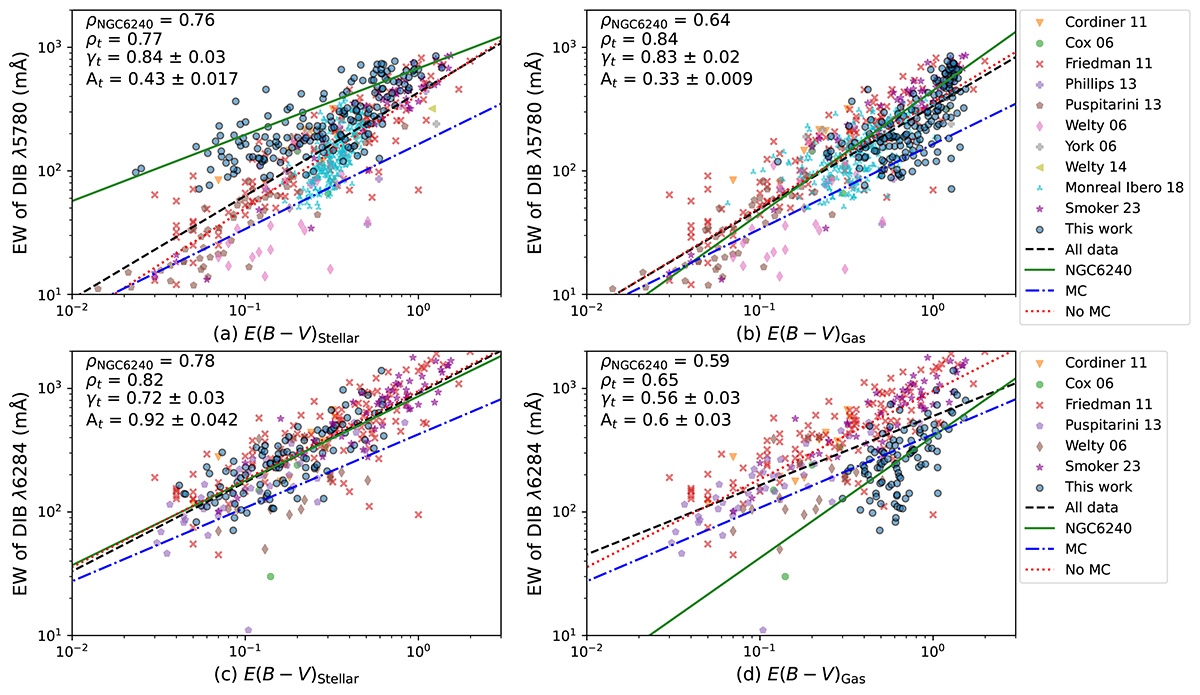
Fig. 9.
Download original image
Comparison of the stellar and gas E(B − V) and the equivalent widths of the DIBs at λ5780 and λ6284, as measured by various studies. The black (green, blue, red) dashed (solid, dash-dotted, dotted) line is the power law fitted to all available (NGC 6240, MC, previous studies except MC) data, mathematically presented in Eq. (3), using the γt and At values shown in the corresponding figure. The correlation between the EW of the DIBs and E(B − V) using solely our and the total the data is also shown, by the Pearson correlation coefficient, respectively ρNGC6240 and ρ. The top figures show the attenuation of the stellar continuum (a) and Balmer decrement (b) (Eq. (2)) with respect to DIBλ5780. The bottom panels show the attenuation of the stellar continuum (c) and Balmer decrement in relation with DIBλ6284. The fitting parameters for the NGC6240, MC, no MC, and the Lan et al. (2015) fits are presented in Table 3.
Current usage metrics show cumulative count of Article Views (full-text article views including HTML views, PDF and ePub downloads, according to the available data) and Abstracts Views on Vision4Press platform.
Data correspond to usage on the plateform after 2015. The current usage metrics is available 48-96 hours after online publication and is updated daily on week days.
Initial download of the metrics may take a while.