Fig. 7.
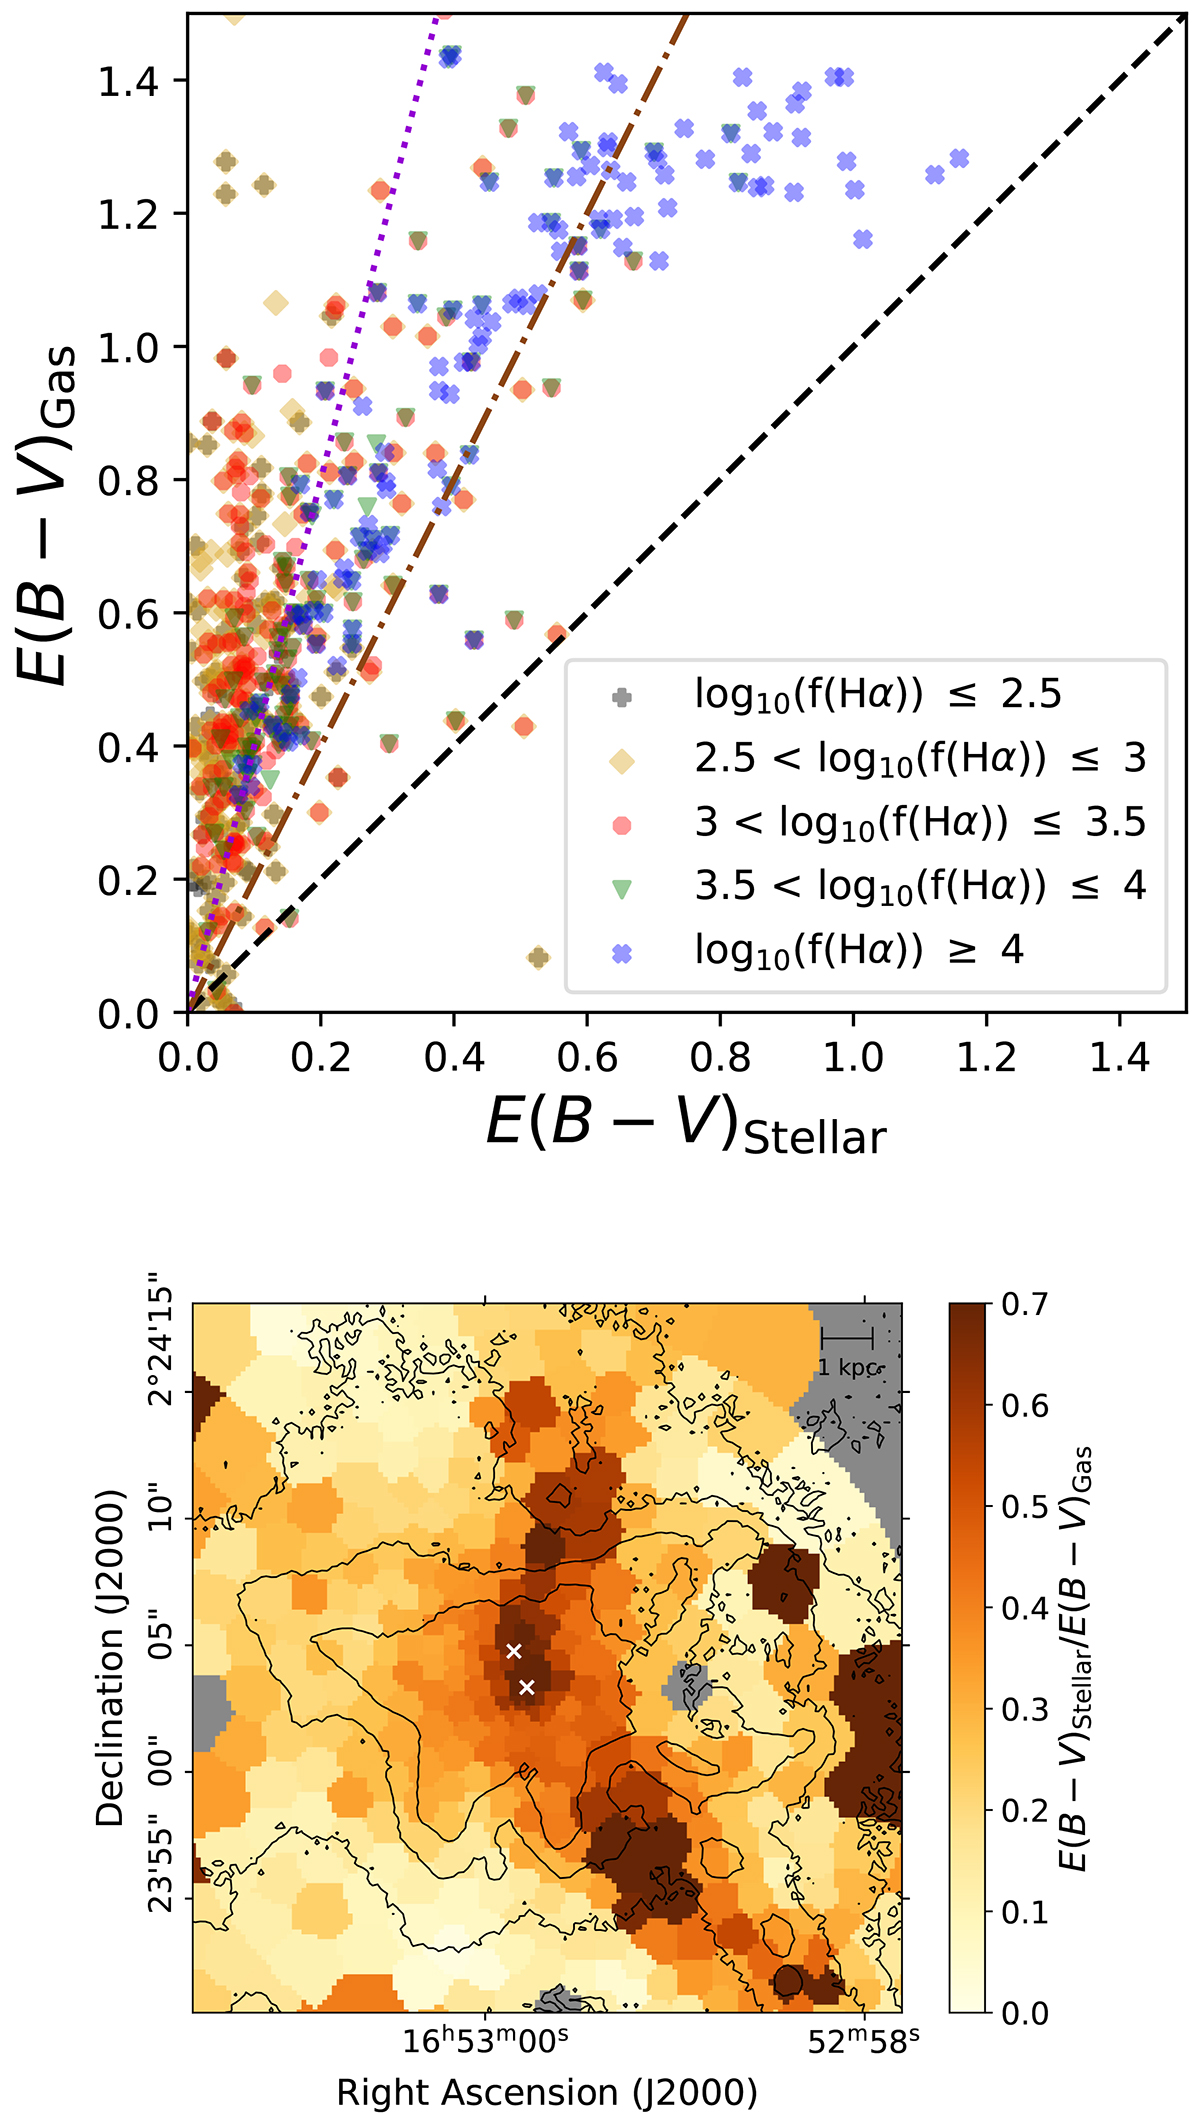
Download original image
Comparison of the reddening traced by the gas and the stars. In the plot on the top, data points are colored according to five different bins in surface brightness with units of f(Hα) 10−20 erg s−1 cm−2 spaxel−1, corresponding with the black contours earlier used in the paper. The black dashed line indicates a one-to-one relation, the brown dash-dotted line is the relation E(B − V)Stellar = 0.5 × E(B − V)Gas, and the purple dotted line is the relation E(B − V)Stellar = 0.25 × E(B − V)Gas. The bottom map shows the ratio of E(B − V)Stellar/E(B − V)Gas in each tile. The locations of the AGNs are marked with white crosses (Komossa et al. 2003).
Current usage metrics show cumulative count of Article Views (full-text article views including HTML views, PDF and ePub downloads, according to the available data) and Abstracts Views on Vision4Press platform.
Data correspond to usage on the plateform after 2015. The current usage metrics is available 48-96 hours after online publication and is updated daily on week days.
Initial download of the metrics may take a while.