Open Access
Fig. 6.
Download original image
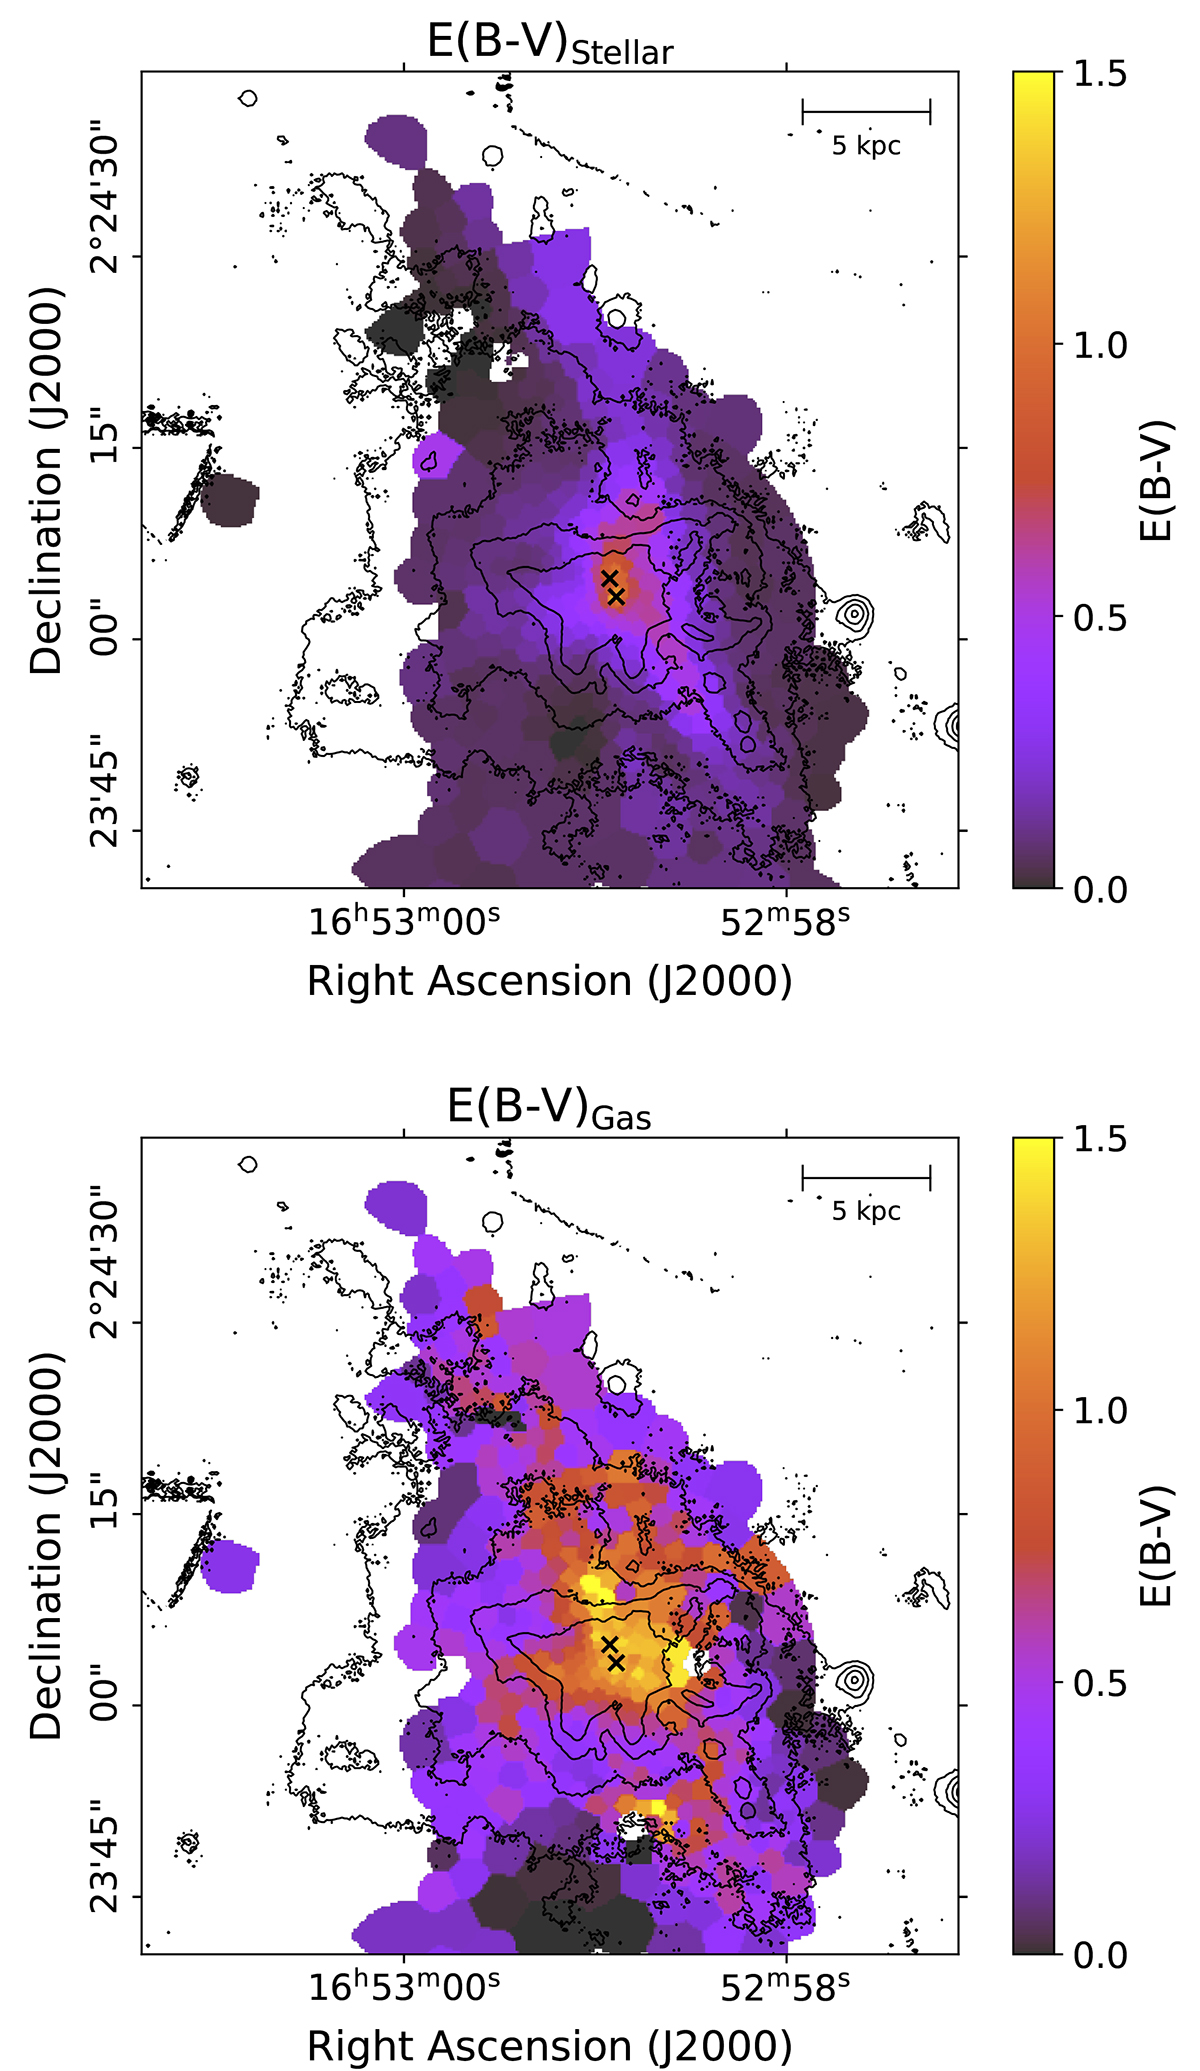
Maps of the E(B − V) for the stellar continuum and diffuse gas. The top figure shows the attenuation of the stellar continuum. The bottom figure shows the attenuation as derived from the Balmer decrement. The black contours trace Hα emission. The locations of the AGNs are marked with black crosses (Komossa et al. 2003).
Current usage metrics show cumulative count of Article Views (full-text article views including HTML views, PDF and ePub downloads, according to the available data) and Abstracts Views on Vision4Press platform.
Data correspond to usage on the plateform after 2015. The current usage metrics is available 48-96 hours after online publication and is updated daily on week days.
Initial download of the metrics may take a while.