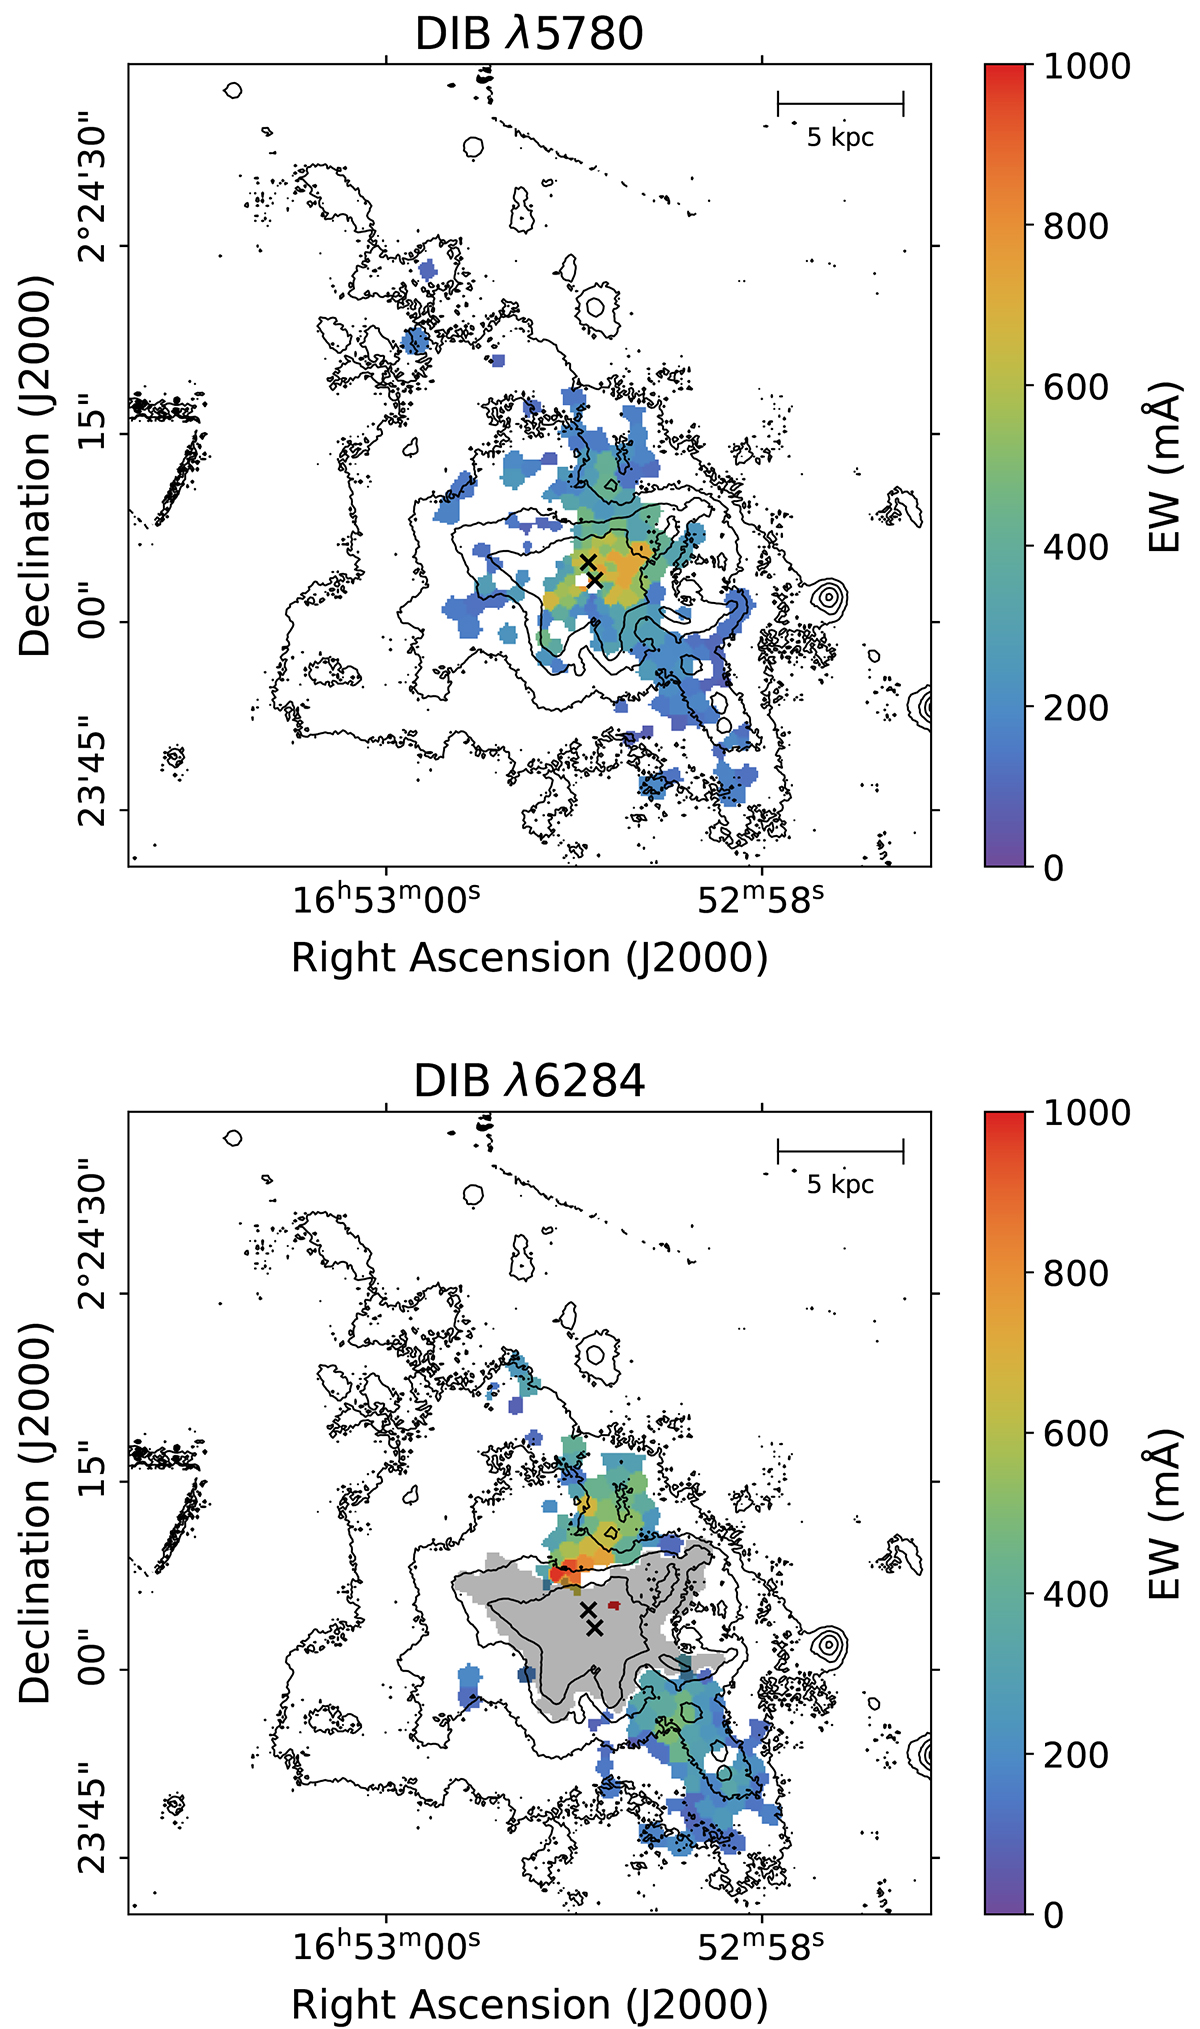
Fig. 5.
Download original image
Maps of detections of DIB λ5780 (top) and DIBλ6284 (bottom). In the bottom panel, the gray area is the region where EW([O I]λ6300) ≥ 10 Å. The lack of DIBλ6284 detections in these tiles is likely an observational artefact, as the line is blended with the broader [O I]λ6300 feature. The black contours trace the Hα emission and the black crosses show the locations of the AGNs (Komossa et al. 2003).
Current usage metrics show cumulative count of Article Views (full-text article views including HTML views, PDF and ePub downloads, according to the available data) and Abstracts Views on Vision4Press platform.
Data correspond to usage on the plateform after 2015. The current usage metrics is available 48-96 hours after online publication and is updated daily on week days.
Initial download of the metrics may take a while.