Fig. 3.
Download original image
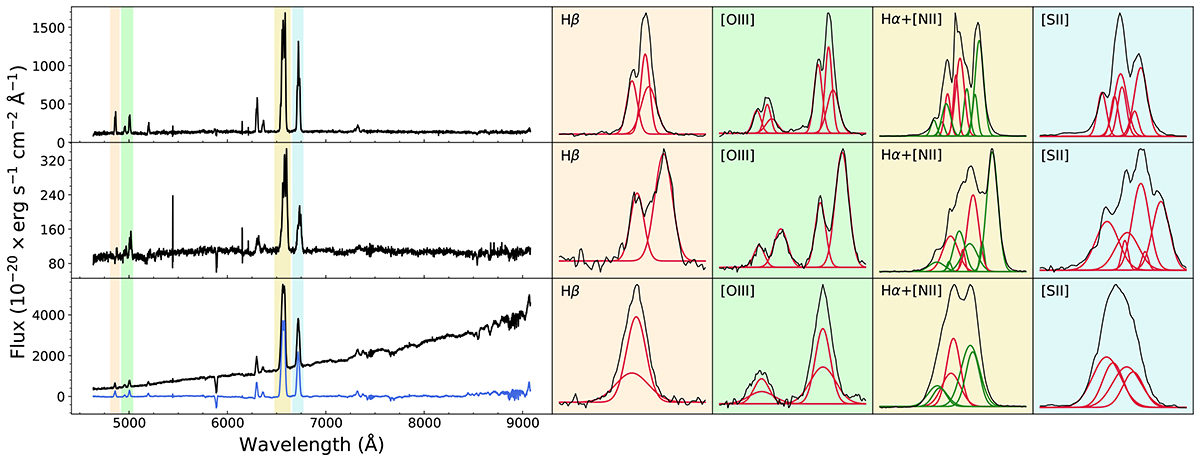
Sample of different NGC6240 rest-frame spectra and their fits. The left hand side of the figure shows the binned and unmodeled spectra, in black. The colored regions indicate the important emission features, which are zoomed in on the right including their fits. In the Hα+[N II] complex the green fits correspond with the [N II] doublet. In the bottom figure, the blue spectrum represents the residual, where the stellar model is subtracted from the binned data. From top to bottom, these spectra are respectively measured in the regions: southeast of the AGNs, a dusty region west of the AGNs, and a bin at the location of the AGNs.
Current usage metrics show cumulative count of Article Views (full-text article views including HTML views, PDF and ePub downloads, according to the available data) and Abstracts Views on Vision4Press platform.
Data correspond to usage on the plateform after 2015. The current usage metrics is available 48-96 hours after online publication and is updated daily on week days.
Initial download of the metrics may take a while.