Open Access
Fig. 11.
Download original image
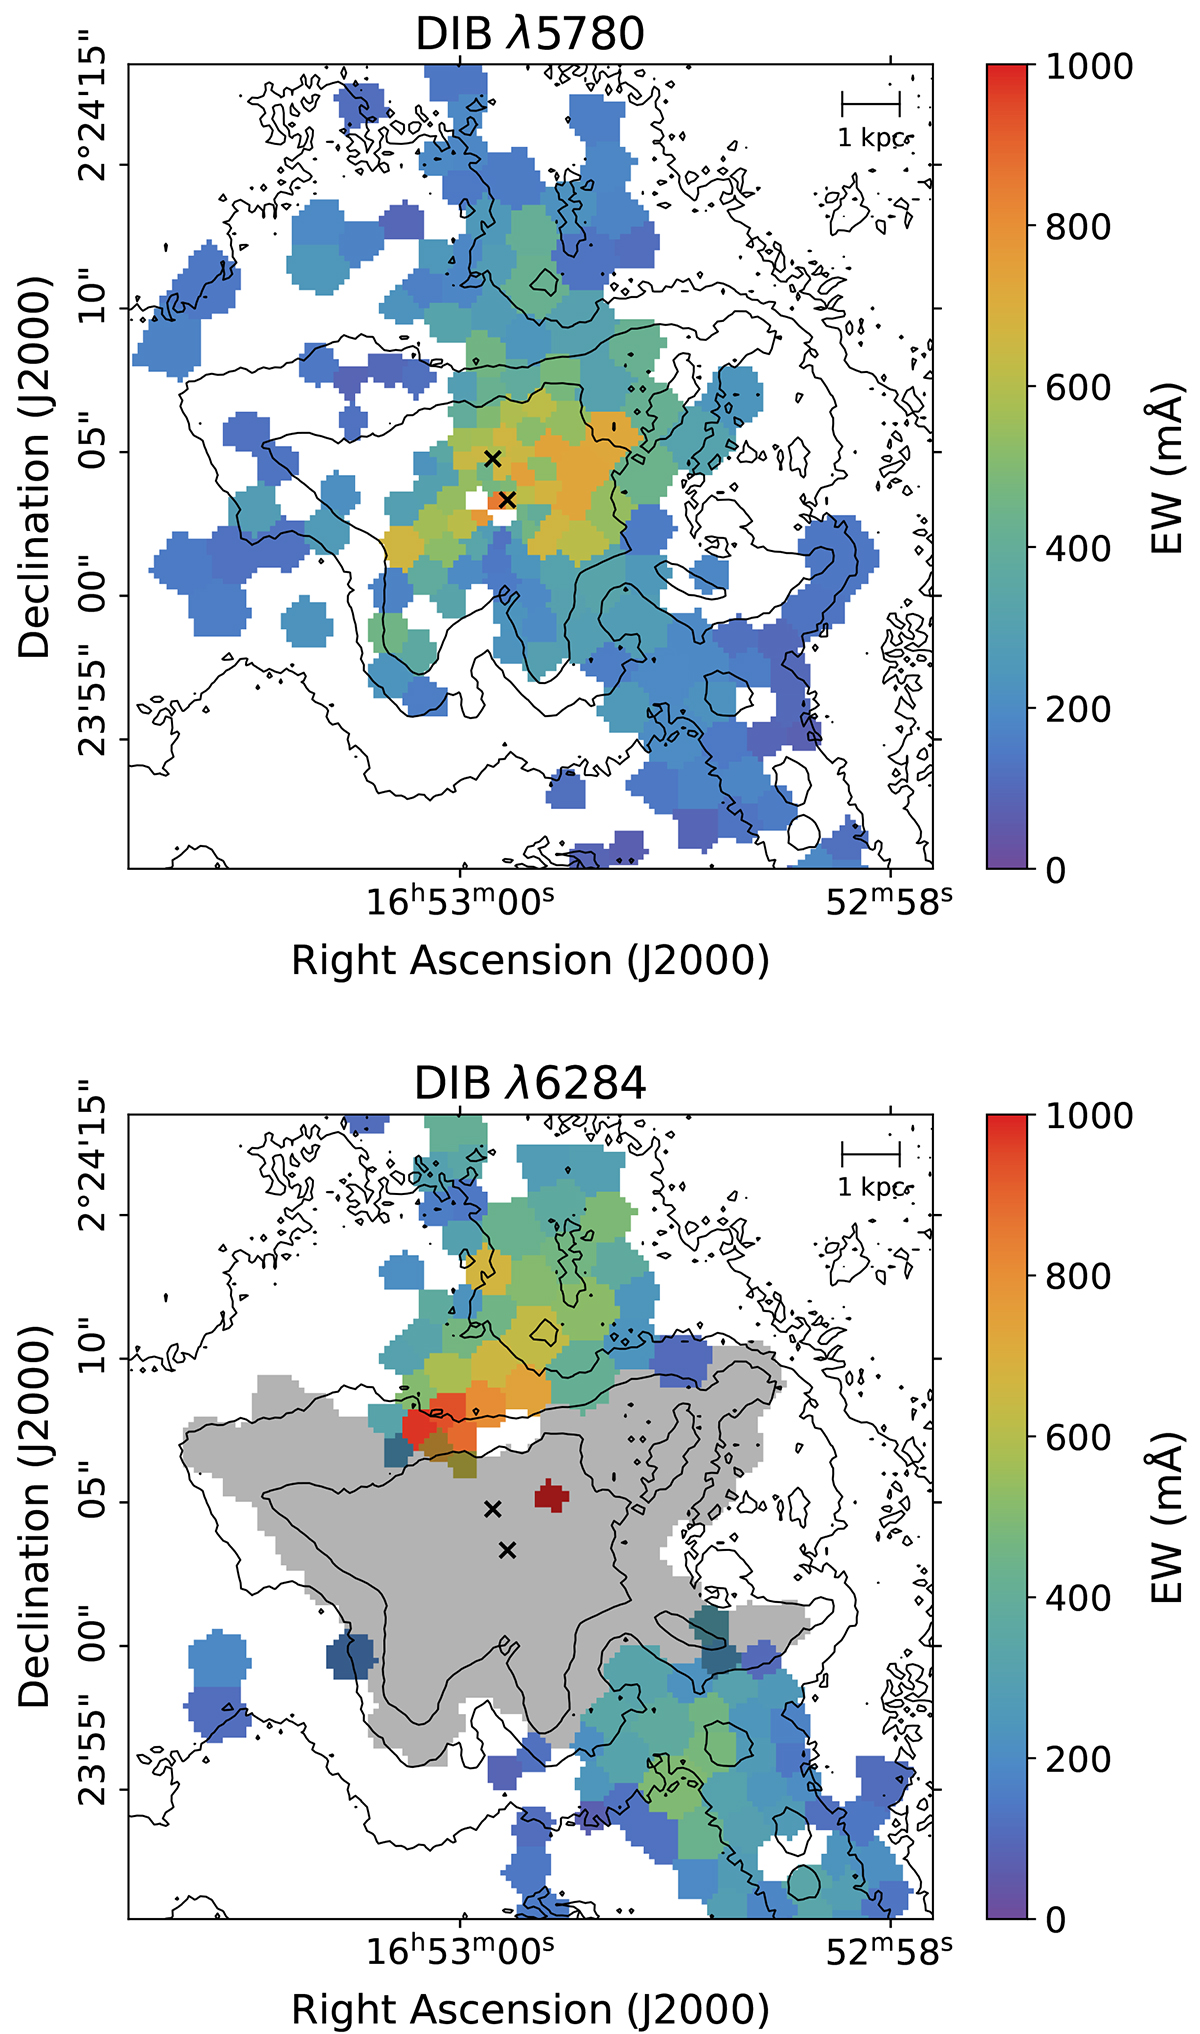
Map of DIBλ5780 (top) and λ6284 (bottom) near the AGNs of NGC 6240. These figures are all the exact same region that is marked by the white square in Fig. 1. The black contours show the Hα narrowband emission and the black crosses show the locations of the AGNs (Komossa et al. 2003).
Current usage metrics show cumulative count of Article Views (full-text article views including HTML views, PDF and ePub downloads, according to the available data) and Abstracts Views on Vision4Press platform.
Data correspond to usage on the plateform after 2015. The current usage metrics is available 48-96 hours after online publication and is updated daily on week days.
Initial download of the metrics may take a while.