Fig. 1.
Download original image
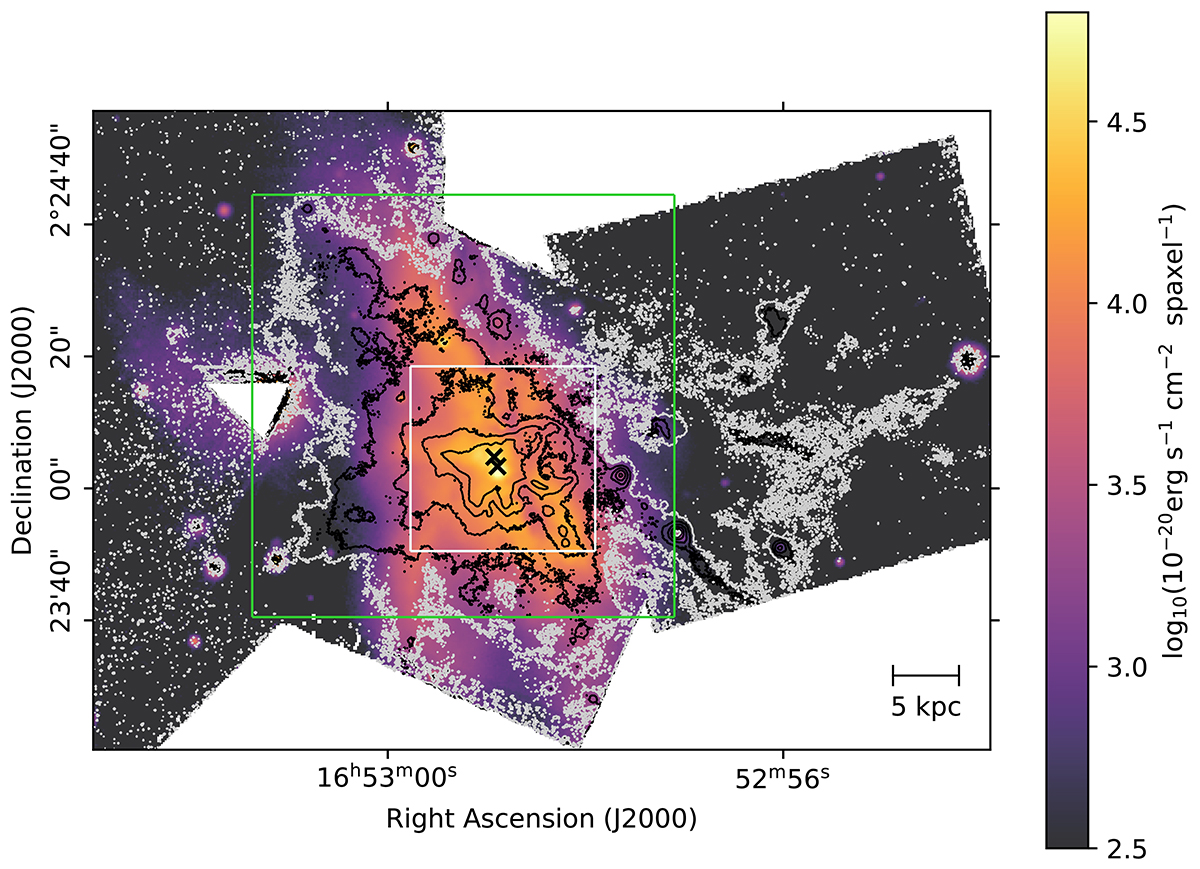
Line-free continuum map created from the full MUSE datacube in the observed frame with a wavelength range of ![]() . In this figure, north is to the top and east to the left. The white contour is the peak Hα flux with a logarithmic intensity of 2, clearly showing an extended emission of Hα to the west of this merger. The black contours also trace the integrated Hα flux in logarithmic intensities [2.5,3.0,3.5,4.0] with units of f(Hα) = 10−20 erg s−1 cm−2 spaxel−1, which are also used throughout the rest of this paper. The green square indicates the region of this merger that is used for nearly all spatial maps in this paper, for instance, in Fig. 2. The white square is a zoomed-in section around the nucleus, used in Fig. 11. The black crosses show the locations of the AGNs (Komossa et al. 2003).
. In this figure, north is to the top and east to the left. The white contour is the peak Hα flux with a logarithmic intensity of 2, clearly showing an extended emission of Hα to the west of this merger. The black contours also trace the integrated Hα flux in logarithmic intensities [2.5,3.0,3.5,4.0] with units of f(Hα) = 10−20 erg s−1 cm−2 spaxel−1, which are also used throughout the rest of this paper. The green square indicates the region of this merger that is used for nearly all spatial maps in this paper, for instance, in Fig. 2. The white square is a zoomed-in section around the nucleus, used in Fig. 11. The black crosses show the locations of the AGNs (Komossa et al. 2003).
Current usage metrics show cumulative count of Article Views (full-text article views including HTML views, PDF and ePub downloads, according to the available data) and Abstracts Views on Vision4Press platform.
Data correspond to usage on the plateform after 2015. The current usage metrics is available 48-96 hours after online publication and is updated daily on week days.
Initial download of the metrics may take a while.