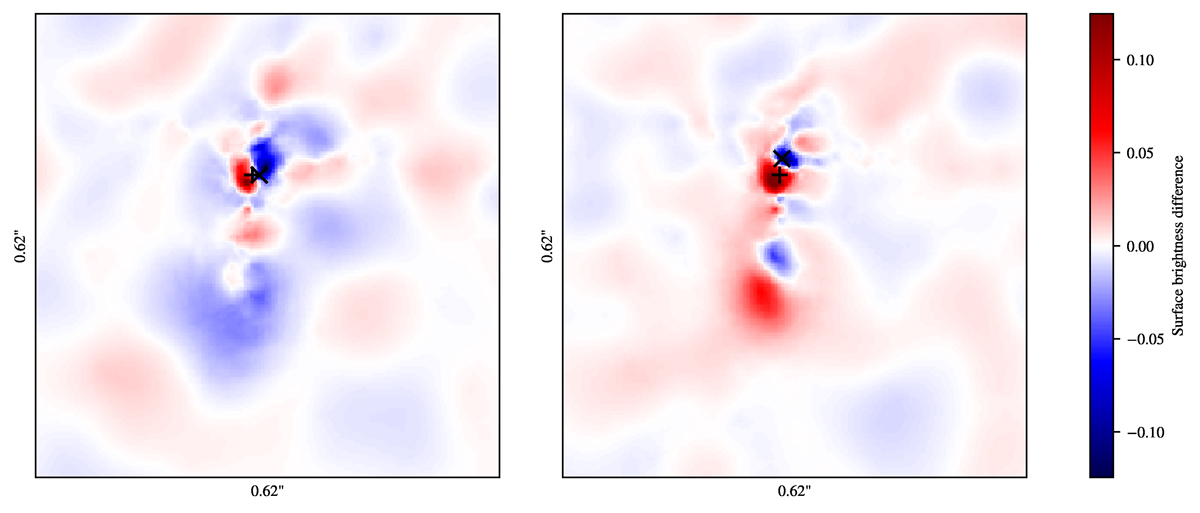
Fig. 7.
Download original image
Difference in the sources brightness distribution in the source plane obtained when modelling the systems in 𝒟1 with a lens following an elliptical power law profile with additional external shear. If SX is the source surface brightness distribution obtained for the system X, these images are the result of SUnperturbed − S1 keV (left) and SUnperturbed − S3 keV (right). The local surface brightness of the reconstructed source can be shifted and modified in the perturbed models if some of the additional perturbations are absorbed by variations of the main lens properties. The general trend given by these images is that the main effect of the additional perturbation is an overall shift of the source, which is indicated by corresponding red and blue regions of the 2D brightness distribution. To highlight this effect, the black markers give the point of highest surface brightness (‘+’ for the unperturbed system and ‘x’ for the perturbed one).
Current usage metrics show cumulative count of Article Views (full-text article views including HTML views, PDF and ePub downloads, according to the available data) and Abstracts Views on Vision4Press platform.
Data correspond to usage on the plateform after 2015. The current usage metrics is available 48-96 hours after online publication and is updated daily on week days.
Initial download of the metrics may take a while.