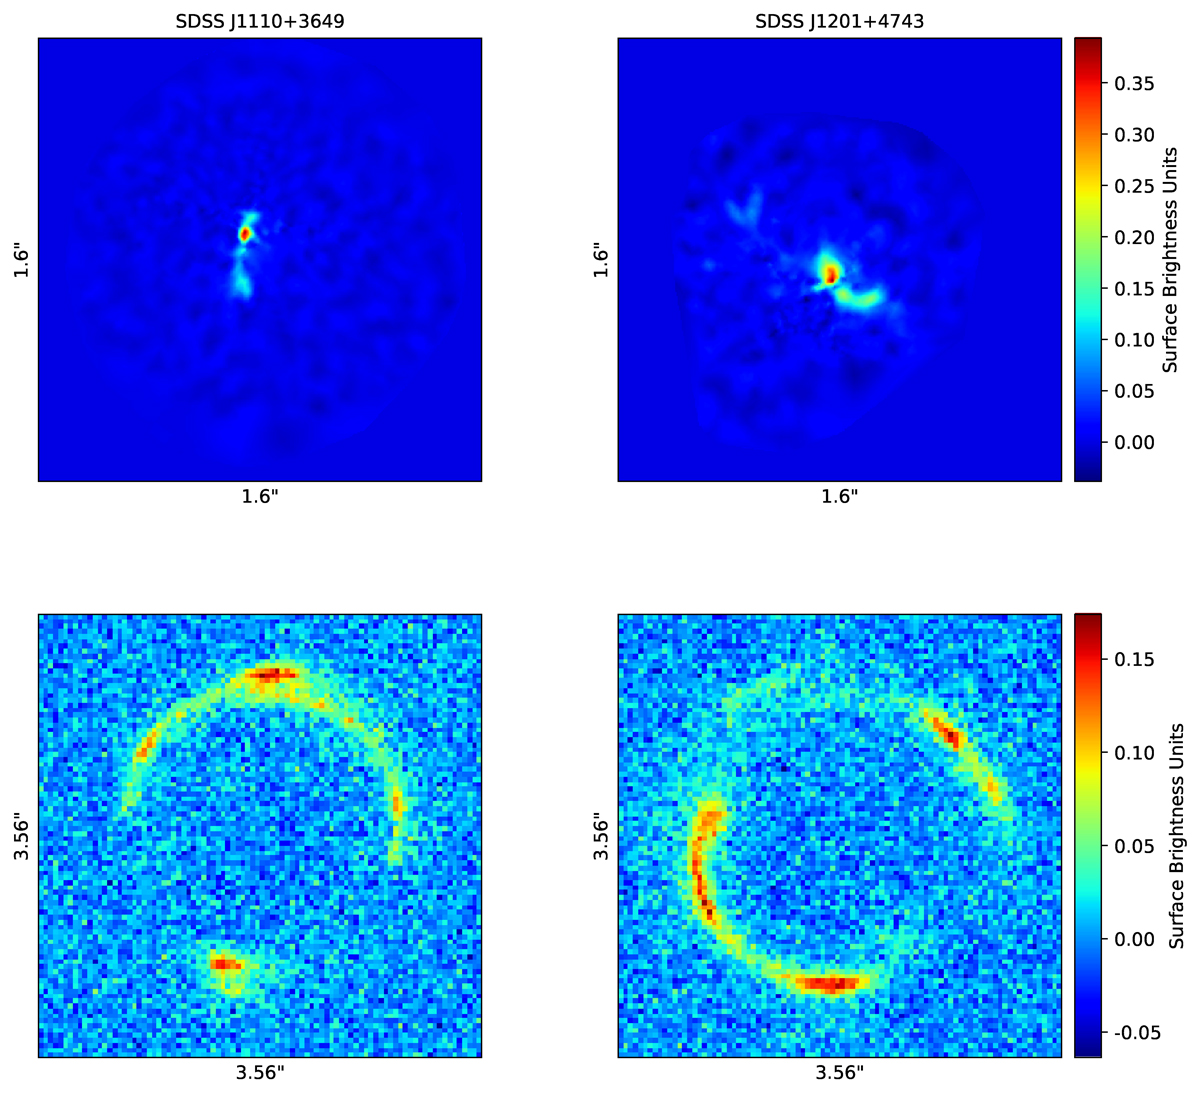
Fig. 4.
Download original image
Left panels: System SDSS J1110+3649. Right panels: System SDSS J1201+4743. The top panels represent the source brightness distribution and the bottom panels represent the observed flux after propagating through the lens, convolving with an HST-type point spread function, and adding a Gaussian noise resulting in a signal to noise ratio of 10.
Current usage metrics show cumulative count of Article Views (full-text article views including HTML views, PDF and ePub downloads, according to the available data) and Abstracts Views on Vision4Press platform.
Data correspond to usage on the plateform after 2015. The current usage metrics is available 48-96 hours after online publication and is updated daily on week days.
Initial download of the metrics may take a while.