Fig. 4.
Download original image
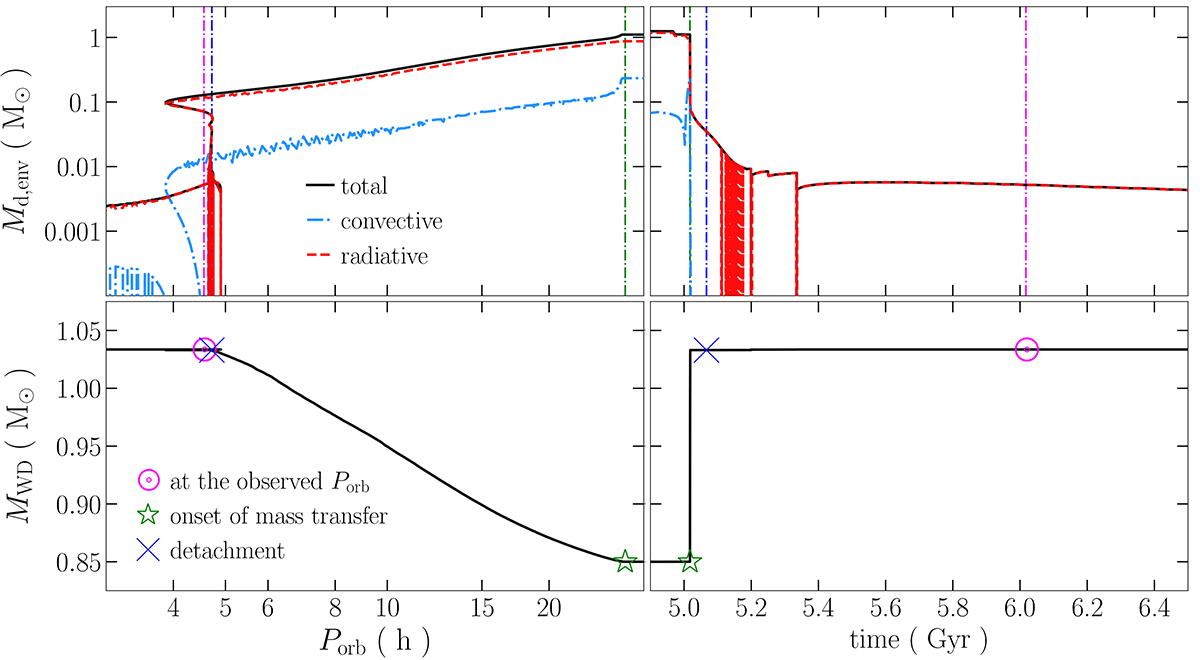
Donor envelope mass (top panels) and WD mass (bottom panels) evolution with orbital period (left panels) and time (right panels). The vertical blue lines mark the time and orbital period at which the binary detaches, the vertical magenta lines correspond to the observed orbital period, and the vertical green lines mark the onset of mass transfer. The symbols have the same meaning as in Fig. 2.
Current usage metrics show cumulative count of Article Views (full-text article views including HTML views, PDF and ePub downloads, according to the available data) and Abstracts Views on Vision4Press platform.
Data correspond to usage on the plateform after 2015. The current usage metrics is available 48-96 hours after online publication and is updated daily on week days.
Initial download of the metrics may take a while.