Fig. 5.
Download original image
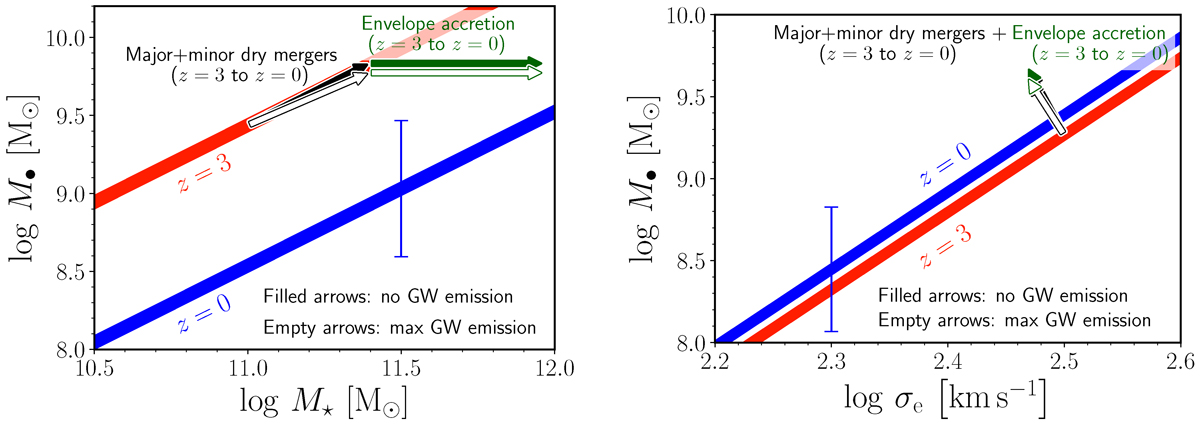
ETG evolution in stellar mass, BH mass, and effective velocity dispersion, due to major and minor mergers, and envelope accretion. Left panel: The blue line is the median relation between central BH mass M• and stellar mass M⋆ measured for observed massive z = 0 ETGs by Saglia et al. (2016), with the intrinsic scatter represented by the blue vertical bar. The red line is an estimate of the median relationship at z = 3, obtained by assuming that the logarithmic slope is the same as at z = 0 and that the normalization is such that the relic galaxy NCG 1277 lies on it (see text). The arrows indicate the expected evolution down to z = 0 of a z = 3 progenitor due to the combination of major and minor mergers, and envelope accretion. The filled and empty arrows correspond, respectively, to the two extreme cases of no mass loss via GW emission (M• ∝ M⋆) and of maximal mass loss due to GW emission (see text). Right panel: Same as left panel, but for the relation between M• and effective velocity dispersion σe. Also in this case the z = 0 correlation is the median obtained by Saglia et al. (2016).
Current usage metrics show cumulative count of Article Views (full-text article views including HTML views, PDF and ePub downloads, according to the available data) and Abstracts Views on Vision4Press platform.
Data correspond to usage on the plateform after 2015. The current usage metrics is available 48-96 hours after online publication and is updated daily on week days.
Initial download of the metrics may take a while.