Fig. 1.
Download original image
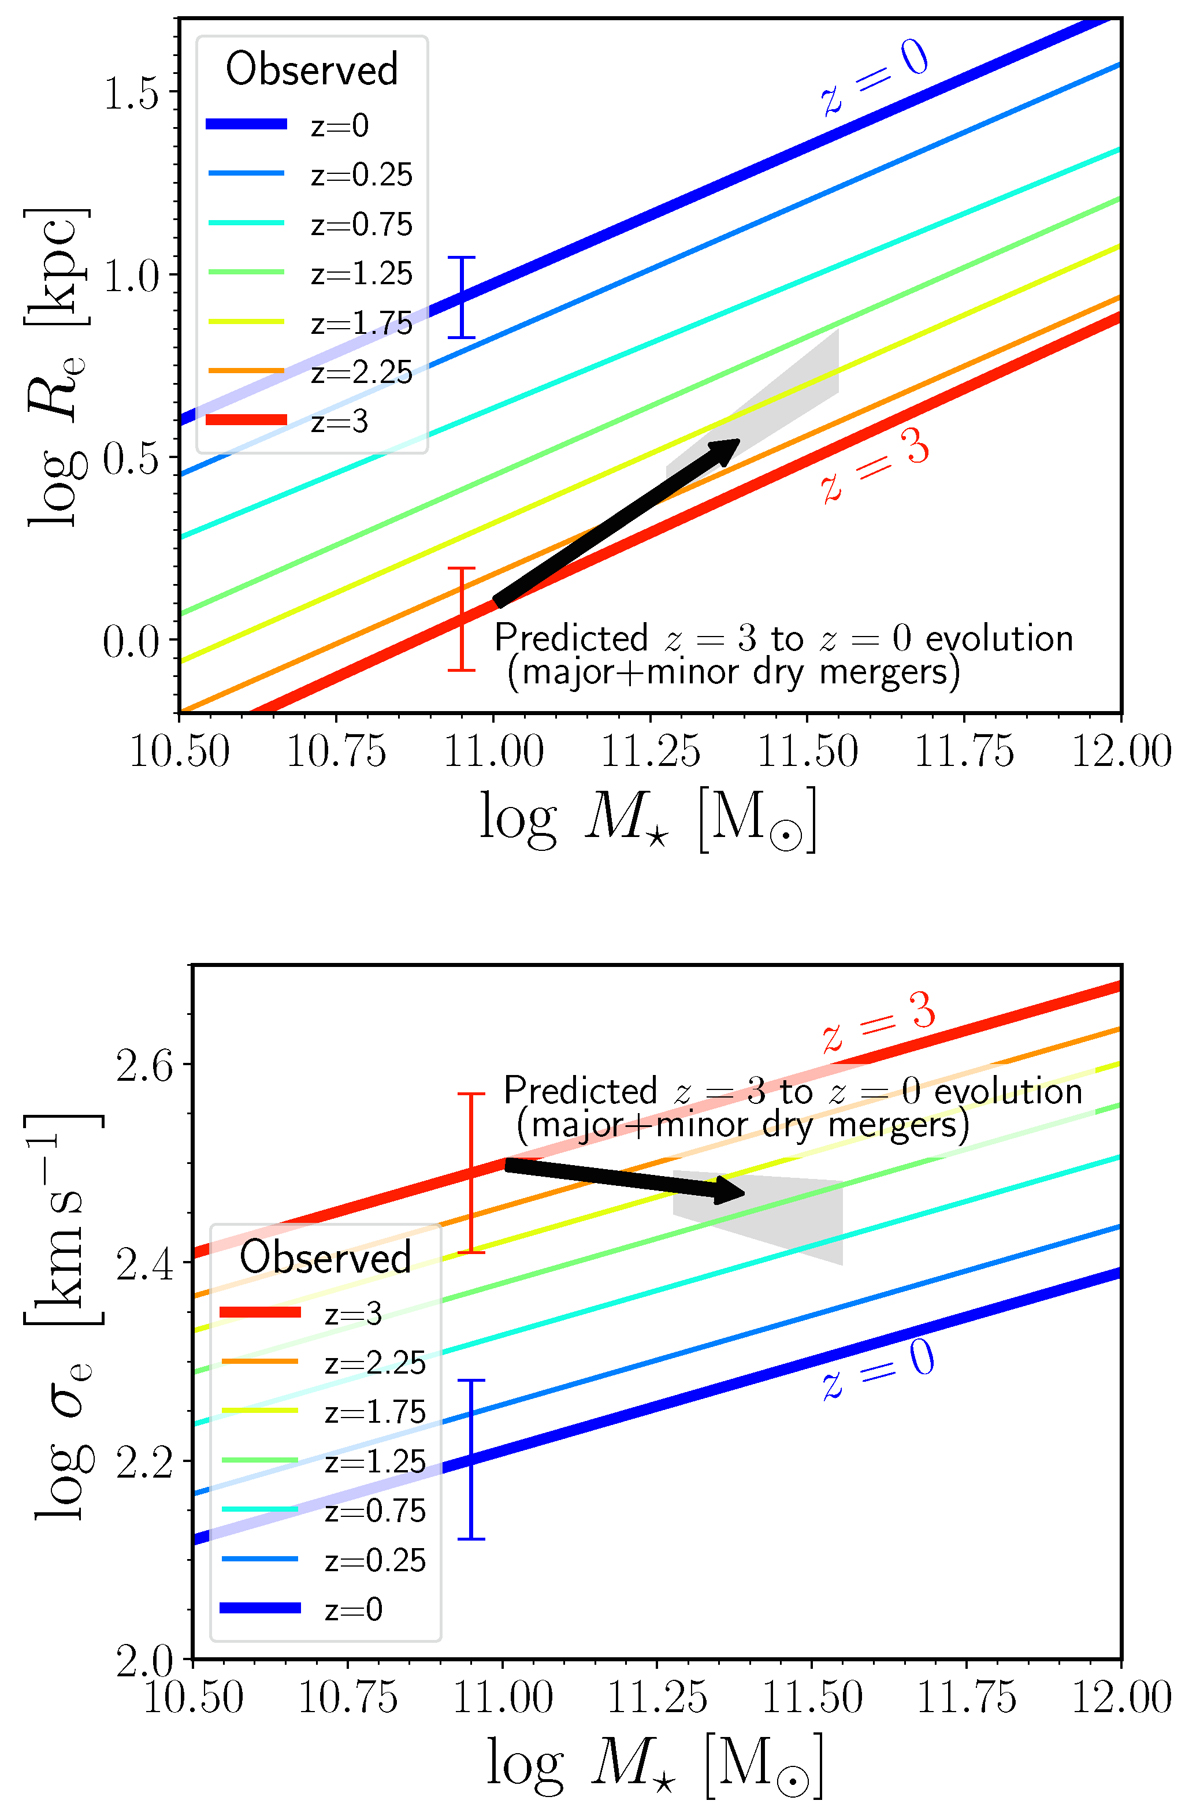
ETG evolution in stellar mass, effective radius, and effective velocity dispersion, due to major and minor mergers. Upper panel: Effective radius, Re, as a function of stellar mass, M⋆. The lines indicate the median observed Re-M⋆ relations of ETGs at different redshifts (van der Wel et al. 2014). Lower panel: Effective stellar velocity dispersion, σe, as a function of stellar mass, M⋆. The lines indicate the median observed σe-M⋆ relations of ETGs at different redshifts (Cannarozzo et al. 2020). In each panel the black arrow indicates the predicted evolution of a representative model ETG from z = 3 (tail of the arrow) to z = 0 (head of the arrow), under the effect of major (ξ > 1/4) and minor (1/10 < ξ < 1/4) dissipationless mergers occurring at the rates observationally estimated by Conselice et al. (2022). The grey area represents the uncertainty in the position of the head of the arrow. The blue and red error bars indicate the intrinsic scatter of the scaling relations at z = 0 and z = 3, respectively.
Current usage metrics show cumulative count of Article Views (full-text article views including HTML views, PDF and ePub downloads, according to the available data) and Abstracts Views on Vision4Press platform.
Data correspond to usage on the plateform after 2015. The current usage metrics is available 48-96 hours after online publication and is updated daily on week days.
Initial download of the metrics may take a while.