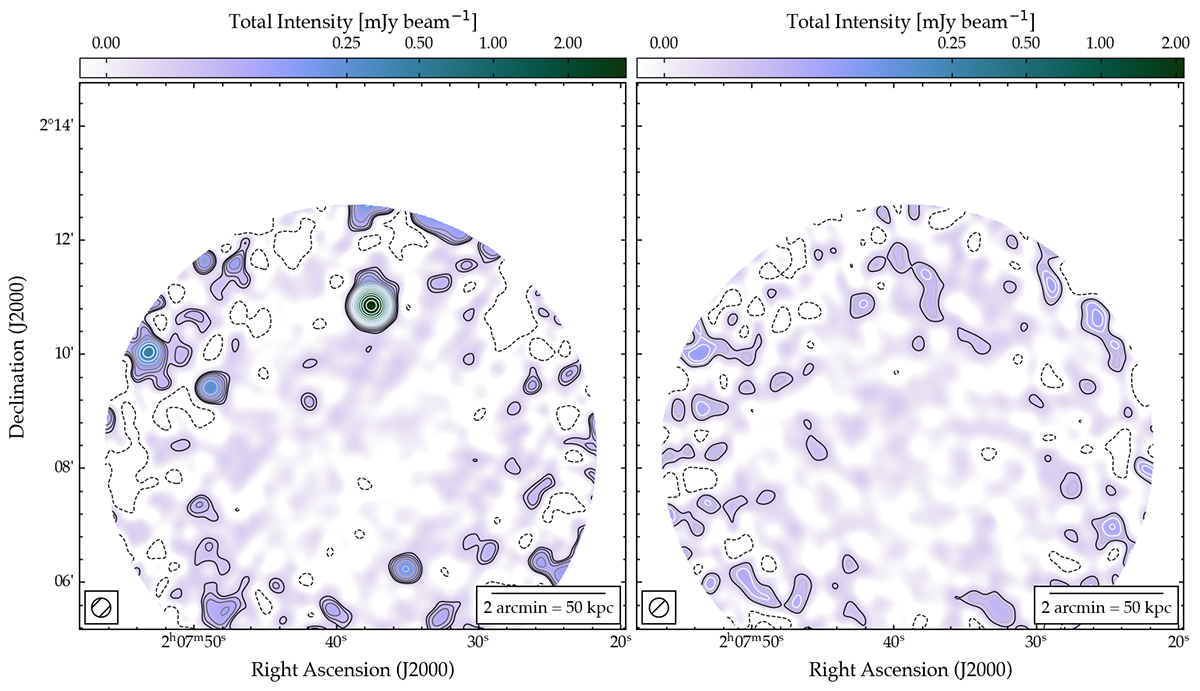
Fig. 9.
Download original image
VLA 7 GHz maps of HCG15 at 20 arcsec resolution, before (left and after (right) subtracting the discrete radio sources associated with the group. The left-hand panel shows the VLA-D observations only, whereas the right-hand panel shows the combined VLA-C+D dataset. Contours start at 3σ and scale by a factor of ![]() , where σ values are reported in Table 3. Colourmaps range from −1σ to 300σ on an arcsinh stretch to emphasise faint emission, although we note that no significant diffuse emission is detected.
, where σ values are reported in Table 3. Colourmaps range from −1σ to 300σ on an arcsinh stretch to emphasise faint emission, although we note that no significant diffuse emission is detected.
Current usage metrics show cumulative count of Article Views (full-text article views including HTML views, PDF and ePub downloads, according to the available data) and Abstracts Views on Vision4Press platform.
Data correspond to usage on the plateform after 2015. The current usage metrics is available 48-96 hours after online publication and is updated daily on week days.
Initial download of the metrics may take a while.