Fig. 7.
Download original image
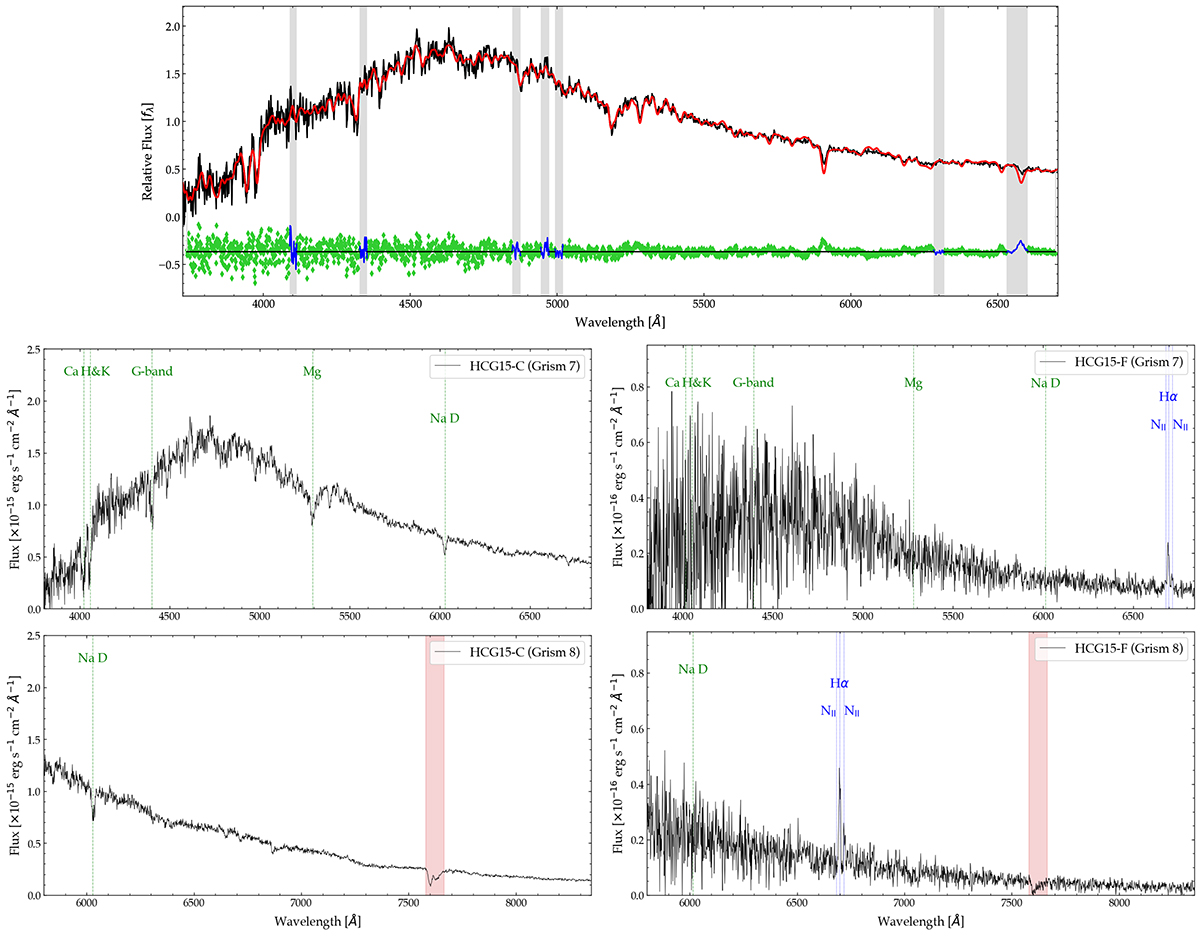
Optical spectra from the HCT for HCG15-C (upper and left panels) and HCG15-F (right panels). The spectrum for each Grism is shown separately, with Grism-7 in the upper row and Grism-8 in the lower row. All wavelengths are quoted in the observer frame. Known emission and absorption features are marked at their observed wavelengths using the best-fit recession velocities of 6803 ± 12 km s−1 for HCG15-C and 6133 ± 98 km s−1 for HCG15-F, with green for absorption features and blue for emission lines. The shaded red region marks a known sky absorption feature. Note that in the spectrum of HCG15-C, no emission lines are detected, only the marked NaD, Mg, G-band and Ca H & K absorption features. Conversely for HCG15-F the only detected feature is the Hα emission line, with a tentative sign of the [N II] doublet; no absorption features are detected.
Current usage metrics show cumulative count of Article Views (full-text article views including HTML views, PDF and ePub downloads, according to the available data) and Abstracts Views on Vision4Press platform.
Data correspond to usage on the plateform after 2015. The current usage metrics is available 48-96 hours after online publication and is updated daily on week days.
Initial download of the metrics may take a while.