Fig. 3.
Download original image
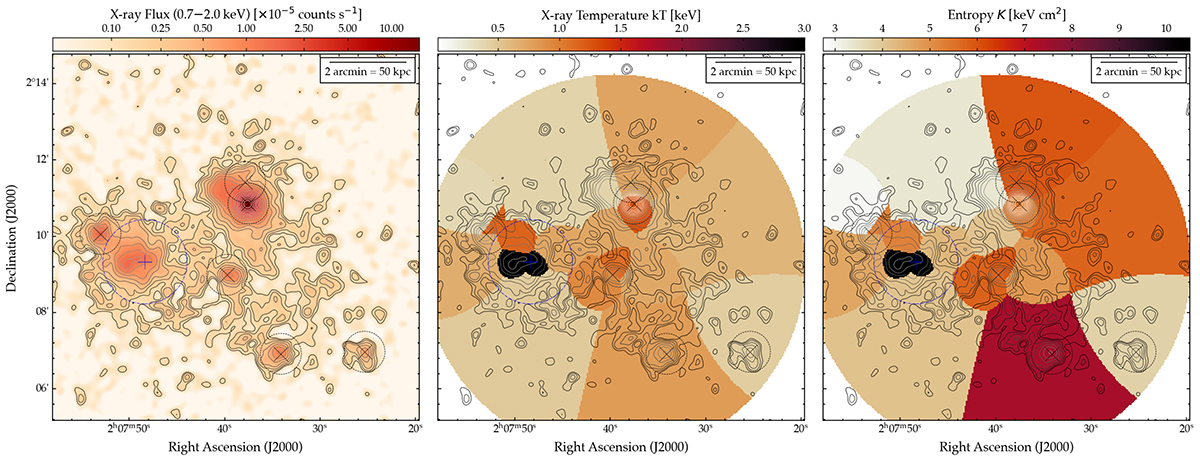
Thermodynamic maps of HCG15 produced from XMM-Newton. From left to right, the panels show the X-ray surface brightness, X-ray temperature, and pseudo-entropy. Contours show the X-ray surface brightness as per the left panel, starting at a level of 1.2 × 10⁻⁶ counts s−1 (4σ) and scaling by a factor of ![]() . The ‘X’ markers in circles denote the positions of the six group-member galaxies. The ‘+’ indicates the SZ position of the background cluster at z ≃ 0.88 reported by Klein et al. (2024), with the circle denoting a 500 kpc radius at redshift 0.88.
. The ‘X’ markers in circles denote the positions of the six group-member galaxies. The ‘+’ indicates the SZ position of the background cluster at z ≃ 0.88 reported by Klein et al. (2024), with the circle denoting a 500 kpc radius at redshift 0.88.
Current usage metrics show cumulative count of Article Views (full-text article views including HTML views, PDF and ePub downloads, according to the available data) and Abstracts Views on Vision4Press platform.
Data correspond to usage on the plateform after 2015. The current usage metrics is available 48-96 hours after online publication and is updated daily on week days.
Initial download of the metrics may take a while.