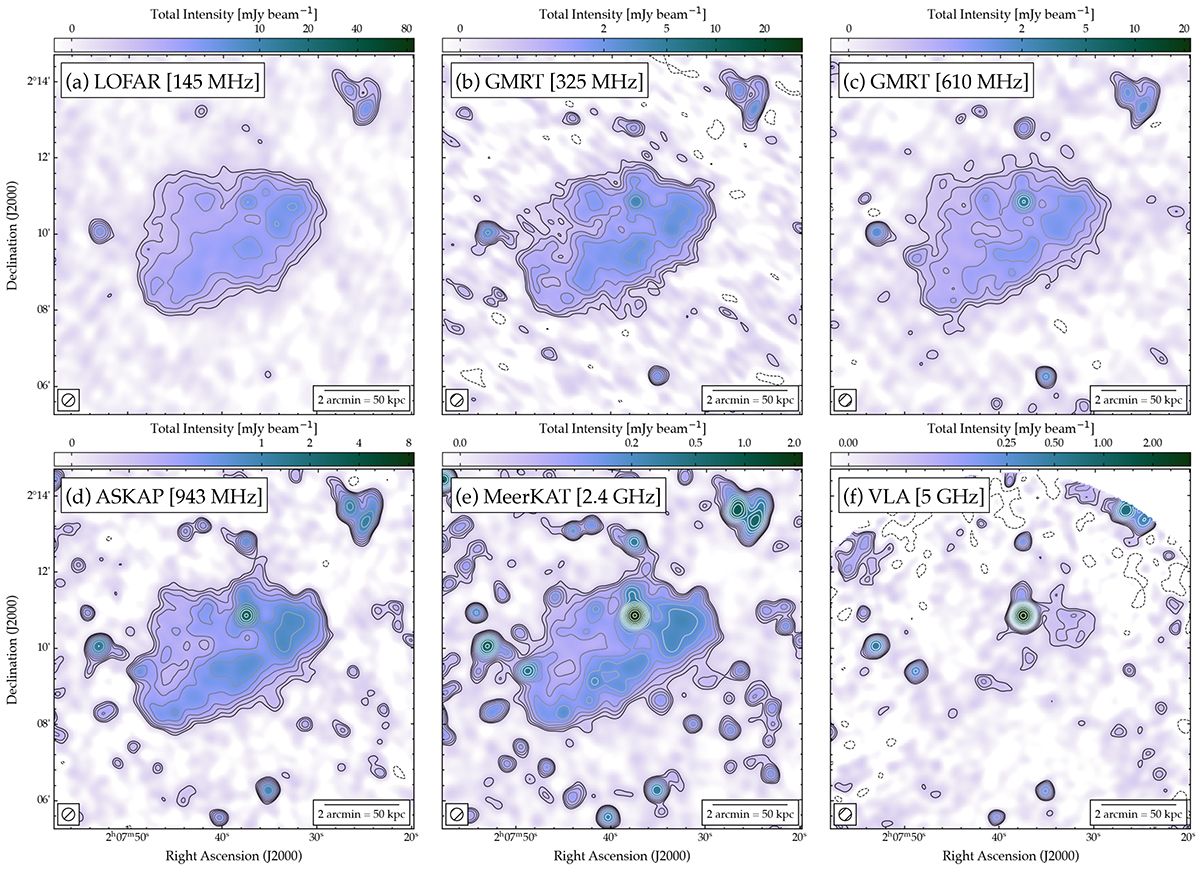
Fig. 2.
Download original image
Radio continuum maps of HCG15 from 145 MHz to 5 GHz, shown before subtraction of emission from discrete radio sources. From top-left, panels show (a) LOFAR at 145 MHz, (b) GMRT at 325 MHz, (c) GMRT at 610 MHz, (d) ASKAP at 943 MHz, (e) MeerKAT at 2.4 GHz, and (f) VLA at 5 GHz. All maps are shown at a resolution of 20 arcsec, indicated by the hatched circle in the lower-left corner. Note that panel (f) shows the image produced from VLA-D configuration data only due to the variability of HCG15-D (see Sect. 3.4). Contours start at 3σ and scale by a factor of ![]() , where σ values are reported in Table 3. Colourmaps range from −1σ to 300σ on an arcsinh stretch to emphasise faint emission.
, where σ values are reported in Table 3. Colourmaps range from −1σ to 300σ on an arcsinh stretch to emphasise faint emission.
Current usage metrics show cumulative count of Article Views (full-text article views including HTML views, PDF and ePub downloads, according to the available data) and Abstracts Views on Vision4Press platform.
Data correspond to usage on the plateform after 2015. The current usage metrics is available 48-96 hours after online publication and is updated daily on week days.
Initial download of the metrics may take a while.