Fig. 17.
Download original image
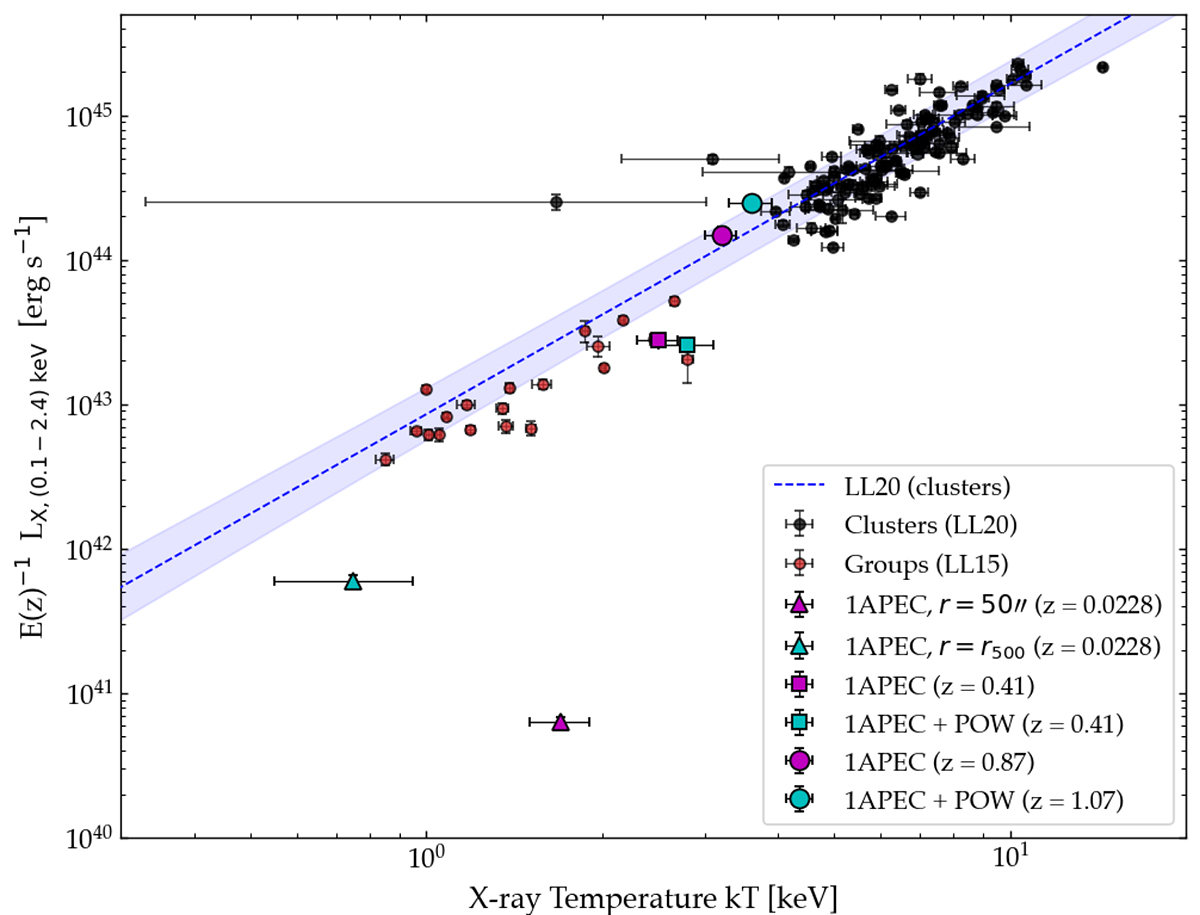
Scaling relation between X-ray temperature (kT) and luminosity in the 0.1 − 2.4 keV band for samples of galaxy groups (LL15; Lovisari et al. 2015) and clusters (LL20; Lovisari et al. 2020). Blue line and shaded region denotes the best-fit relation from LL20 (their Table 4, LX − T, third row). Cyan and pink markers show fits to the secondary diffuse X-ray component viewed in projection on HCG15, as described in the text.
Current usage metrics show cumulative count of Article Views (full-text article views including HTML views, PDF and ePub downloads, according to the available data) and Abstracts Views on Vision4Press platform.
Data correspond to usage on the plateform after 2015. The current usage metrics is available 48-96 hours after online publication and is updated daily on week days.
Initial download of the metrics may take a while.